Thursday, 28 February 2013

Endorsing euro again!

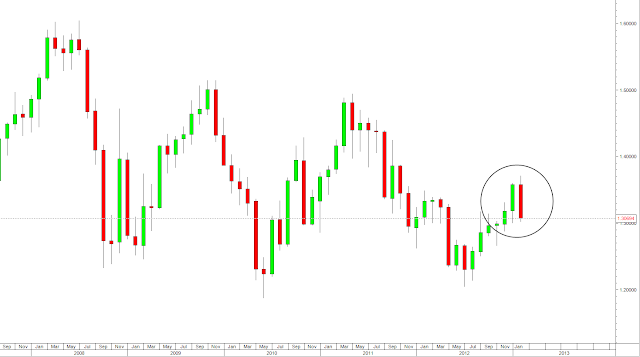
Today is the last day of February and it will be enlightening to see where the E$ will close in NY. There is a high likelihood that February will close weak considering how much it had fallen but we can still gauge the level of bearishness basing on these probable closing levels and its implication for the month ahead. In case it exceeds my expectation, I shall update all again. Meantime, refer to the E$ monthly chart posted yesterday.

Closing level
Above 1.3375                                      - Likely to end up as Harami, a weaker bearish signal
Above 1.3180 but below 1.3375         - Dark Cloud Cover pattern, a bearish signal
Below 1.3180                                      - Bearish Engulfing pattern, a very bearish signal

Overnight, E$ managed to recapture the 1.3120/30 pivot level and that is the first important signal for the bears to sit up and pay attention to. That being said, it is way too premature to determine that as a reversal signal especially when we have a major risk event out of the US tomorrow.

In "E$ in the months ahead, 27 Feb", one would have gathered that I am looking for a couple of levels lower at 1.2880 and then 1.2690/700, which coincidentally are the 50% and 61.8% Fibonacci correction ratios. The likelihood of market testing 1.2880/900 is high but the probability of the next leg down to 1.2690/700 falls off quite significantly and will be contingent on how E$ close for Feb and its reaction to the outcome of the US budget problem.
Having said all these, I remain a euro bull (since 23 Feb 12, "Its my turn, said EUR" and reinforced again on 23 Aug, 12, "Happy days ahead for EUR?") and still maintain that 2013 will be a good year for the euro, including its crosses.

For today, intraday indicators are close to o/b levels though not extreme. Intraday oscillator indicators are pointing to range consolidation which at current level should have abit more headroom. But I do not foresee E$ being able to sustain up there for long and expect rate to fall back closer to the lower band of the day's expected range of 1.3110/20 to 1.3220/30.

E$ Daily chart - Recapturing DMA100 indicates strength?


Wednesday, 27 February 2013

E$ in the months ahead

Reaction to Bernanke's dovish comments was quite muted as market continues to consolidate from the parabolic price action the day before. Its probably trying to catch some breath before refocusing on the US sequester where the deadline is 1 March, not forgetting tomorrow is the month end close.
I thought this could be the best time to take a step back, neutralize our market bias, take a good objective look and plan ahead for next few weeks.
I have put together bullish and bearish technical signals to compare and finally to determine the most likely outcome.

Bullish Signals

  • Daily indicators are at oversold levels
  • Recent parabolic price action normally indicates market close to the end of trend, be it primary or secondary
  • Intraday oscillator indicators are showing bullish divergence
Bearish Signals
  • Month of February's candlestick should close with a Dark Cloud Cover (unless E$ is able rally back above 1.3380 to alleviate the bearish pressure)
  • Price is staying below the Daily MA21 / 50 & 100, Weekly MA21 / 100 & 200 and Monthly MA21 / 50 & 100
  • Weekly oscillators are pointing down

Other information:
Fibonacci ratio levels basing on the low of 1.2043 to the high of 1.3710
38.2%   1.3070
50.0%   1.2880
61.8%   1.2690

Macro level
In the E$ monthly chart below, I have highlighted a close resemblance of market's reaction on its first challenge above the MMA21 & 50 (red & green respectively). It was followed by a sharp sell-off in the subsequent month and spent around 2 months to consolidate to form a base for its next leg up.
Micro level
With a reversal Dark Cloud Cover candlestick pattern potentially happening in February, I expect further pressure on the E$ to test 1.2880 first followed by a rebound towards 1.33/3400 and subsequently 1.2700 to complete the correction (see chart).

For today, shorter intraday momentum are turning from down to consolidation but longer intraday is still pointing lower. With E$ still hovering below the 1.3120/30 pivot, it is still technically weak and is vulnerable for further probe to the downside. Expected initial rebound but 1.3090/3110 to cap. Expect range 1.2950/60 to 1.3090/3110. Short term bearishness is only alleviated when E$ is able to regain the pivot level.

If you are interested to learn more about the US sequester, information can be found in this website.
http://en.wikipedia.org/wiki/Budget_Control_Act_of_2011

E$ Monthly chart - Pattern repetition?

Tuesday, 26 February 2013

Still in the zone!

Good Tuesday afternoon, friends!!

I warned you, didn't I? Yesterday was the perfect full moon effect at its best when coincided with major news release. After last night, I hope I have more believers now. I shall remind all once again that tonight is still within the zone and possibly Bernanke will be the one who will inject the volatility. I thought I was aggressive in forecasting an expanded range of 1.3100/20 to 1.3330/50 but the actual range yesterday was 1.3048 to 1.3318!! Most limit or stop loss orders on the downside have been cleared and we are now left with only these noteworthy ones below.

London order book across the market:
Stop loss: 1.2850, 1.2875, 1.2910/00 and 1.29998

Technically, market is at o/s levels and shorter intraday oscillator indicators showing bullish divergent signal. Though there are signs of waning momentum, the longer intraday indicators are still pointing down. Expanded range to cater for Bernanke, 1.3000/10 to 1.3200/10 with short term pivot resistance at 1.3120/30. Frankly, I am still not keen to engage the market yet as I feel market is very news sensitive for now. I prefer to watch for this month's close to get a better idea on what to expect in March. If you have to, remember your stop loss order and stay nimble.
Will sniff for something interesting tomorrow.

E$ Monthly chart - At current level, it will be Dark Cloud Cover

Monday, 25 February 2013

Bear or bull, all around a trend line...

Good Monday afternoon, friends!!

Do you know that yesterday was full moon and +/- 2 days, we are technically within the "zone" till Tuesday? Coincidentally, the major risk events are the result of the Italian election today and Fed Chairman Bernanke's testimony on Tuesday.
As far as the E$ is concerned, the bears will continue to be in control unless the bulls are able to first take price back above the trend line (1.3235) that it broke below, by this week. Another good tell-tale sign will be the February's monthly close this coming Thursday where a close above 1.3380 will alleviate the bearish pressure for March. However, a close below will increase the probability of market probing lower towards 1.29ish.
As far as today is concerned, we cannot ignore the major risk event as it can overwhelm any technical readings. I will present 2 scenarios in reaction to the Italian election result later:
Scenario 1:
Berlusconi did not win: E$ positive, 1.3146 would become near term bottom for market to challenge 1.3350/80 pivot level.
Scenario 2: 
Berlusconi wins: E$ takes a dive towards 1.3100/20 but rebound and stays rangebound under 1.32350/40 and await Bernanke tomorrow.

CFTC COT report: Speculative accounts further reduced their euro net long positions to +19,103 vs +24,181 last week. Net short JPY position increased to -65,891 vs -61,306.

Asian order book across the market:
Stop loss: 1.3130, 1.3150, 1.3260 and 1.3300/10
Limit: 1.3150 and 1.3245/55

Technically, market is recovering from its o/s levels with shorter intraday momentum turning higher supported by bullish divergent signal. However, longer intraday momentum is still pointing down as of now. For today, basing on the above 2 scenarios, the expanded range would be 1.3100/20 to 1.3330/50. Be disciplined and stay nimble!
E$ Weekly chart - Bears in control unless bulls regain above trend line
Update 1:
EURAUD
As promised on "Euro bash!" (21 Feb), here's the follow-up on the micro of this EURxxx pair. Last week, market sold it down to 1.2744 low and it rebound as bullish divergent signal emerged and is currently staying above 1.2800. There are technical signals to indicate that recent sell-off could have completed and it due for its next leg higher. However, we still cannot ignore the 2 major risk events which can still inject volatility ahead of the month end close on Thursday but 1.2750/60 must hold. The first sign of danger for the bears will be a daily close today above 1.2840/50. The next stronger pivot level will be 1.2970/80. A monthly close above that level can springboard rate to 1.3500 in the months ahead.

EURAUD Monthly chart - Retested MMA21 at 1.2760 and held


Friday, 22 February 2013

LTRO2 & Italian election next!

TGIF, friends!

Though I am still holding on to my long E$ position with the market looking poised for a rebound, I must admit that I have kinda lost my market rhythm this week and find myself with the consensus (which is not a good thing). In a situation like this, I will be happy to square my position ahead of the weekend with a small profit and steer clear until after the Italian election. Market's next fundamental focus will be ECB's  announcement of LTRO2 at 1100GMT which is in another about an hour's time.

London order book:
Stop loss: 1.3150/30, 1.3160, 1.3260 and 1.3310
Limit: 1.3150/30, 1.3160 and 1.3245/55
Note that there will be a 1.3200 option expiry at 1500GMT, so market may get "stucked" around that level.

For the E$ today, the crucial pivot point is at 1.3230/35 where recapturing and closing above the trend line it broke below yesterday will turn the technical picture around. Market is coming out of its o/s level. Shorter intraday oscillator indicators are showing waning downside momentum with bullish divergent signal and pointing to consolidation where at current level would have an upside bias but I wary that the longer one is still pointing down. Though this has increased the probability that the recent sell-off could have ended and market is ready for its next leg up, I still need E$ to stay above the trend line or better still closing above 1.3340 (which it does look like a stretch) to neutralize the bear pressure. Next week will be the last trading week for February and its closing level for the month will be closely watched for the underlying strength of the E$ in the months ahead.
Expected range for the rest of the day taking into consideration the LTRO announcement, there is an outside chance of testing 1.3100/20 but I do not think its sustainable and is susceptible to a quick rebound into the 1.3180 to 1.3250/60 range for the most part of the day. 
E$ Daily chart - Re-capturing the trend line?
USDJPY
For those who are hoping for action in USDJPY, I would recommend to have an early weekend. Technical indicators are suggesting that the consolidation to continue into next week at least and not expecting any breakout from the range of Y92.50 to Y93.80.
USDJPY Daily chart - Consolidation to persist

Thursday, 21 February 2013

Euro bash!

Good afternoon, friends!!

Fed's hawkish minutes provided market the best excuse to dump the E$ and flushed huge amount of sell stop orders from 1.3310ish down to 1.3240ish. A rare occasion where the greenback won against almost every other currency. Admittedly, I was thrown off and bruised. Looking back, I should have held back the bullish tone at least till E$ close above the pivot level of 1.3450 post the major risk event instead of jumping the gun. Guess, I was in a way influenced by the firmer EURAUD and EURGBP pair, in which I will elaborate more on the EURAUD below. From now till the Italian election result, E$ may stay more on the conservative side in case of a Berlusconi victory which is E$ negative.

London order book:
Stop loss: 1.3220, 1.3235/30 and 1.3305-20
Limit: 1.3235/30

Technically, intraday indicators are in o/s levels though not at extreme. Shorter intraday oscillator indicators are showing waning downside momentum as bullish divergent signal emerges but longer intraday indicators are still pointing lower. Taking all other technical readings into consideration, I have more signals supporting a near term bottom though cannot confirm a reversal of the recent weeks' downtrend yet. 1.3450 remains an important pivot level and a daily close above would be needed to strengthen that view. Expected range 1.3200/20 to 1.3290/3310. Would like to take a chance to buy on dip on first test with stop below 1.3170. Market will be choppy, so do not forget your trailing stop.
E$ Daily chart - Trend line support
EURAUD
Just a quick one on EURAUD since I was having a chat with my friend. This euro cross is set for a bull run this year after years of sell-off. This bullish view is supported by the bullish divergent signal and the bullish engulfing candlestick pattern. This is a medium term call and I will go micro later. Just want to push this update out asap.

EURAUD 12-weekly chart - Bullish chart pattern


Wednesday, 20 February 2013

Bye 1.33 big figure?

Good morning, friends!

Yes, the only blip in the otherwise flatlined market was the result of a better than expected German ZEW number. Despite the good news, E$ took a final test at the support hoping to flush some stop below 1.3320 but failed at 1.3328 before it stabilized around 1.3450 for the most part of the evening. E$ then rallied at the end of the day to close at 1.3386. The bullish "Morning Doji Star" pattern was confirmed by an early Wednesday morning continuation of the rally taking us up to 1.3435 high so far. The short squeeze has begun? Coincidental that S&P 500 and Nasdaq indexes setting records while the Dow industrials coming close to breaking an all-time record close of 14,164.63, set in October 2007?

NY order book:
Stop loss: 1.3290, 1.3295, 1.3320 and 1.3405
Limit: 1.3250, 1.3280/70, 1.3290 and 1.3320

Technically, intraday momentum has swung upwards with breakaway signal indicating a bottom at 1.33056 has been formed for its next leg up. Pivot remains at 1.3450 and a daily close will increase the probability of a challenge at recent high of 1.3520 with 1.3710 being put back on the radar. If my wave count is correct, this rally is supposed to be an impulsive one (fitting the characteristic of a short squeeze). Expected range 1.3380/3400 to 1.3520/40 with intermediate resistance at 1.3450 and 1.3480. This is one day where I will highly discourage short scalp.
E$ Daily chart - 1.3350, bye for now!

Tuesday, 19 February 2013

Someone is quietly accumulating?

Good afternoon, friends!

Quite clearly the market has decided to mark time for the major risk events taking place this week, starting with the Fed's minutes on Wednesday (Thu, 3am Sin/HK) and LTRO report on Friday and not forgetting Italy's election taking place on the 24/25 Feb (Sun/Mon). But let's hope that before we get there, the German ZEW at 6pm (Sin/HK) today can stimulate the otherwise lacklustre market.

Looking back at the past week or so, I noticed that there were several attempts at the 1.33ish support level but ultimately E$ closed above 1.3350. Reckoned when the "buyers" accumulated enough and sellers get exhausted, a vicious short squeeze will kick in and push rate to test the DMA21 (red) and then the previous high at 1.3520. Of course, in all things, nothing is absolute. This view will be invalidated or delayed if market breaks and close below 1.3280.

London order book:
Stop loss: 1.3265/60, 1.3290/80, 1.3295, 1.3320 and 1.3405
Limit: 1.3250, 1.3265/60, 1.3290/80 and 1.3320

Technically, intraday oscillator indicator are quite mixed but with a slight bias towards higher price action as there was a bullish divergent signal, though still premature to confirm if it will pan out. For today, I maintain a range of 1.3290/3310 to 1.3420/40.
E$ Daily chart - Still trapped but supported

Monday, 18 February 2013

Inverted hammer

Good morning, friends! Its mid-Feb already!!!

True enough, market decided not to take sides on Friday ahead of the G20 summit over the weekend. Now here's where it got tricky..... for one moment, I thought we will fall into Scenario 1 as outlined in "G20 can spring surprises, 15 Feb 13" where a weekly close +/- 5pips around 1.3362 would send a bullish message. But we closed at 1.3355. Nonetheless, I thought E$ could open the new week firmer above the WMA100 (1.3357) on the back of positive message out of the summit but it didn't and we are now hovering just below the resistance (that is a bearish signal). On the bullish side, if we go back to basics, then the weekly inverted hammer pattern should support a reversal story for the E$ after 2 weeks of correction down to 1.3305 low so far. If market recaptures the 1.3350/60 pivot, the bears have to be careful as market would target 1.3500/10 again. For today, the Chinese are finally back from their CNY holiday but the US will be out for Presidents Day.

CFTC COT report: Speculative accounts trimmed its net euro long positions to +24,181 vs +37,952 (-36%). Net JPY short decreased to -61,306 vs -68,413. Psychologically speaking, the inverse relationship may be in favour of the euro bulls.

Asian order book:
Stop loss: 1.3265/60, 1.3295/90 and 1.3405
Limit: 1.3250 and 1.3265

Technically, we are close to intraday o/s levels. However, intraday oscillator indicators are showing a mixed bag of signals. Market may not be ready to take side today and I expect further consolidation within 1.3290/3310 to 1.3400/20. If I have to make a call today, I'll still buy on dips with 2 levels of stops below 1.3280 and 1.3245.

E$ Weekly chart - Staying below the WMA100 & 200

XAUUSD
In my blog on "'V' shaped recovery", 6 Feb 13, I shared with all on my bearish view of the AUDUSD. Concomitantly, the yellow metal cannot escape the high correlation. Just last week, it closed below the WMA100, a technical event that we have not seen for the past 4 years. With that, the probability of XAUUSD heading into $1,500/1,4000 is higher than $1,700/1,800 in the month ahead. In short, yes, I am bearish XAUUSD for now.

XAUUSD Weekly chart - A rare visit below WMA100

Friday, 15 February 2013

G20 can spring surprises...

TGIF friends!

Indeed E$ held the support level and printed a low of 1..3315 before rebounding to a session high of 1.3394 on the back of ECB Weidmann's comment that ECB won't cut interest rates to weaken the euro.
I expect market to consolidate within 1.3300/10 to 1.3390/3400 into Ldn/NY session where the expanded range on the upside to 1.3420/40. I do not expect market to get too directional today ahead of the G20 meeting over the weekend.
3 scenarios for today's NY closing level which will indicate bullishness or bearishness for the E$ next week:
1. +/- 5 pips around 1.3362 (bullish)
2. or a close above 1.3405  (bullish)
3. a close below 1.3280 (bearish)

London order book:
Stop loss: 1.3260, 1.3290 (Large) and 1.3405
Limit: 1.3250 and 1.3300

Technically, market is unwinding its o/b situation with this current correction. Intraday and daily momentum continue to suggest consolidation which at current levels would see more upside potential. However, I am not too keen to engage the market today as the G20 may spring surprises which can overwhelm the technical readings. Expected range 1.3280/3300 to 1.3420/40.
E$ Daily chart - Bull trend technically still healthy despite recent correction

Thursday, 14 February 2013

Bear hug on Valentine's!

Happy Valentine's Day, my friends!! Apologies for the late update as I was upgrading my modem for my fibre optic connection.

E$ indeed stayed within the prescribed range with a low of 1.3425 to 1.3520 yesterday but with lots of whipsaw action in between. It started off with Swiss name buying from the lows but subsequently Asian sovereign name was seen offering around 1.3485. It managed to pull higher, motivated by the stops above 1.3500/10 until it met with supply from the Swiss name again. Prices fell very quickly as market was pretty illiquid and directionless. I expect the consolidation to continue till Friday with the recent wider range intact. This afternoon, E$ got sold off another round on the back of weaker French and German GDP numbers, taking out some stops sub-1.3300 before rebounding to 1.340ish. A break below the DMA21 at 1.3440, coupled with a break of 1.3425, confirms near term weakness with E$ potentially retesting the week's low of 1.3322. 1.3280/3300 forms a solid support which I see should hold for this round. Daily momentum has turned from up to consolidation and admittedly, my bullish call will have to be delayed.

London order book:
Stop loss: 1.3330/20, 1.3365/60 and 1.3580
Limit: 1.3300

Technically, intraday indicators are beginning to slip into o/s territory. Shorter term intraday oscillator is starting to show signs of waning downside momentum which has increased the probability of a bounce.  It may be worth a try to buy on dips towards 1.3310/20 with risk limited to below 1.3280 and profit take around 1.3420/40.
E$ Hourly chart - First sign of bullish divergence


Wednesday, 13 February 2013

Verbal interventions rule for now...

Good Wednesday afternoon, friends!

Recent verbal interventions on the euro has provided us some amount of volatility and market is at this stage panning out closest to the forecasted Scenario 2 ("Fundamentals vs technical day", 7 Feb Thu). Low on Monday was 1.3322 before the rebound recaptured the DMA21 (Red) at 1.3435 overnight. I would expect E$ to consolidate within 1.3400 to 1.3600 for this week and it will be crucial to monitor its momentum for the following week from this Friday's close. Cross referencing the EURxxx and USDJPY, I would expect another week of consolidation as market is pausing after its recent parabolic rally. Lastly, having said all the above, I am still of the opinion that market is still keen to test the 61.8% fibonacci ratio level at 1.3830/40 before a more elaborate correction is due.

CFTC COT report revealed that speculator accounts have increased its net euro long positions to +37,952 vs +27,472. But its net short JPY positions reduced marginally to -68,413 vs -71,246.

Asian order book:
Stop loss: 1.3300, 1.3330/20, 1.3350 and 1.3500
Limit: 1.3300 and 1.3350

Technically, intraday momentum is still pointing up but E$ needs to hold above 1.3420/30 in order to keep its momentum up. I expect lacklustre consolidation into London but feel the move higher to take place only during the Ldn/NY session. Expected range today from 1.3420/30 to 1.3510/20.
E$ Daily chart - Staying above DMA21 (Red)

Thursday, 7 February 2013

Fundamentals vs technical day....

Good afternoon friends!!

E$ gave back more than half of its gains from the rebound on Tuesday as market became cautious going into ECB's meeting and the EU Economic Summit today. Unfortunately for the technical analyst, we must accept that today's price action will be dictated by the overwhelming fundamentals. I therefore have taken as much technical signals blending with either positive or negative news out of the meetings today to come out with these 2 broad scenarios for a 72-hours time frame. Ultimately, I continue to subscribe to buying on dip strategy but would split up the notional amount to even 3 portions.

Scenario 1:
E$ takes dip below Tuesday's low of 1.3458 but holds 1.3420/30 for a rebound to 1.3630/50. Thereafter to consolidate within for an eventual breakout on the upside for 1.3820/30.
E$ 4hourly chart - Scenario 1
Scenario 2:
E$ to hold firm into the news release and rally to retest the upside but cap around 1.3630/50 to plummet subsequently toward 1.3300/30 before it reverses to resume to the bull trend for 1.3820/30.
E$ 4hourly chart - Scenario 2
Nikkei 225 & USDJPY - The macro picture
Recently, a few of my friends have lots of interest in the Japanese market and so I thought would be opportune to share my technical view on the Nikkei 225 against the USDJPY trend. Many have asked, are we there yet? I sensed fear rather than euphoria. Therefore, in short, no I don't think we are there yet and I believe we are in an early stage of a medium term rally. Let's just take aim at the MMA100 (Brown) as the initial target for now. I will elaborate more and provide a micro picture in the days ahead.

Nikkei 225 Monthly chart - Stretched? think again
USDJPY Monthly - Positive correlation

Wednesday, 6 February 2013

"V" shaped recovery (Update1)

Good afternoon friends.

E$ staged a remarkable "V" shaped recovery after falling to a low of 1.3458 yesterday. Reserve manager interest was cited and the rebound picked up momentum as profit taking turned to short covering and the squeeze continued into NY to top off at 1.3597 before closing at 1.3581. This has formed a bullish piercing candlestick pattern and has increased the probability of further upside push today. As guided in my update yesterday, euro bulls would have gotten very much a clear confirmation if it has closed above 1.3600. But market preferred to leave us pondering and search for more supportive signals instead. For those who have not read yesterday's update, "Trend change? I think not...", do spend some time looking through the 3 charts.

Asian order book:
Stop loss: 1.3400-360, 1.3435/30, <1.3459 and 1.3485/80
Limit: 1.3420, 1.3459 and 1.3635/40

Technically, if E$ continues to stay within this tight range into early Europe, short term intraday momentum will start to turn from up to consolidation which at this level, would be down. Expect initial range to be confined to 1.3530/40 to 1.3600/10 during London session with a subsequent break to upper range of 1.3600/10 to 1.3680/90 during the Ldn/NY session. However, a daily close below 1.3530/40 would hurt the near term recovery with 1.3458 and then 1.3415/3380 back in focus. That being said, its just a deeper and more elaborate correction within a very bullish medium term outlook.

Will provide an update on my bearish AUD view later.
E$ Daily chart - Bullish Piercing pattern countered the Dar Cloud Cover
Update1
AUDUSD
The currency's recent numerous failed attempts above 1.0580/0600 have resulted in market turning around for the path with least resistance. Having just breached the previous low of 1.0345 today, technically speaking, has weakened the technical outlook and will put 1.0220 in focus and subsequently 1.0150 and finally the 61.8% Fibonacci ratio target of around parity. This goes very much in line with my medium term bullish outlook of EURAUD heading towards 1.3500/4000 if we use a simplistic "inverted head and shoulder" pattern for projection.
AUDUSD Weekly chart - 61.8% Fibonacci ratio @ around parity
EURAUD Weekly chart - WMA21/50 crossover

Tuesday, 5 February 2013

Trend change? I think not....

Good afternoon friends!!

E$ chose to react to the negative news as it was ripe for a correction yesterday. I was expecting a move lower but I must admit, it fell more and faster than I expected within 2 trading sessions, touching a low of 1.3459 and took out at least 8 layers of stop loss orders!! That left many pondering if the euro bull trend has ended and we are in for a much deeper correction. I have attached 3 charts below, the daily, weekly and then monthly. On the daily chart, price action does look stretched against the moving averages and a quick reversion followed by some sideway consolidation will relieve the overbought  situation. However, on the weekly and monthly chart, one would have realized that E$ is actually quite close to the moving averages which implies that price action is not stretched and a vicious mean reversion is not due yet. In fact, on the weekly chart, we are only in the early stage after the golden cross (see Weekly chart). Therefore, I maintain that the bull trend is very much intact and there is still mileage on the upside with 1.3820/30 being the first target.

London order book:
Stop loss: 1.3400/360, 1.3435/30 and 1.3540 (cleared)
Limit: 1.3420, 1.3580 and 1.3635/40

Technically, this afternoon's rebound has unwound an extreme o/s condition and shorter intraday momentum has turned from down to  consolidation, which at the lower level would signal further rebound. However, longer intraday momentum is still pointing lower at this hour but has indication that the past couple of hours's price action was a powerful move. Recapturing 1.3550 going into NY will be a mildly bullish technical signal and for a test of 1.3590/600. For today, a close above 1.3540 to 1.3590/600 is a mildly bullish signal. A close above 1.3600 will put 1.3710 back on the radar. Conversely, a close below 1.3500 would expose 1.3410/20 and subsequently 1.3370/80 for a more elaborate correction. For now, I place 60/40 probability that we see 1.3820/30 first rather than 1.3300. Let's see how the market close in NY today :)
E$ Daily chart - DMA21/50 and DMA100/200 crossovers

E$ Weekly chart - WMA21/50 crossover

E$ Monthly chart - Price around the mean

Monday, 4 February 2013

Fibo still the near term target....

Good Monday morning, friends!

E$ came alive as it whipsawed as expected during Friday's session in reaction to the US employment data dropping to a low of 1.35727 before it turned to rally to the high of 1.3711, taking out the 1.3700 barrier. But E$ came off the high to close around 1.3608 as profit taking set in when market talk of potential verbal intervention from ECB officials on the recent strength of the euro. Uptrend remains very much intact and it takes a close below 1.3520/30 to show first sign of weakness. Major risk event will be this Thursday's ECB rate decision.

CFTC's COT report: Speculative accounts added on their net long euro position to +27,472 vs +21,381 the week before. Net short yen position at -71,246 vs -64,068 the week before.

Technically, intraday indicators are in o/b levels and in the process of unwinding. Intraday momentum has turned from up to consolidation and Friday's high of 1.3711 should now be the near term cap. For today, I expect market to stay very much within 1. 3600/20 to 1.3690/700 with 1.3540/50 to 1.3820/30 being the weekly range.
E$ Weekly chart - 61.8% Fibonacci ratio target @ 1.3830/40


Friday, 1 February 2013

Bulls very much in command!

TGIF and a happy February, friends!!!

E$ continues its relentless push higher on the back of the firm close from last month. The next serious resistance is at around 1.3800/30 and it is only a matter when (I expect to see by Feb13) and not whether it will reach there. Price action has been constructive and momentum firm. In view of that, a sharp reversal is probably not imminent until at least after a parabolic rally. As long as many out there are still struggling to reconcile with euro's recent performance against its fundamentals, it will continue its march northwards. The easy money part is over and we should expect whipsaw intraday price action but building on higher lows and higher highs. For now at least, there is no reason to go against the trend but to embrace it.

London order book is looking quite busy:
Stop loss: 1.3485/80, 1.3515/490, 1.3535/30, 1.3570, 1.3650 and 1.3675/85
Limit: 1.3485/80, 1.3650 and 1.3675/85

Technically, shorter intraday indicators at o/b levels and a consolidation lower is needed to unwind. Longer intraday and daily momentum continue to point up which suggest that buying on dip is still the preferred strategy. A close today at around 1.3550-70 region would provide first sign of weakness and a close below 1.3540 would indicate a deeper correction towards 1.34ish. For today, I expect trading range within 1.3570 to 1.3660/70. In view of the important US employment data, an expanded range of 1.3520/30 to 1.3680/700.
E$ Monthly chart - 61.8% Fibonacci ratio @ 1.3830
EURGBP
Despite the bearish candlestick patterns, EURGBP held up very well and the correction was shallower than expected. Price action has turned around where risk/rewards does not favour selling anymore.