Friday 28 September 2012

Double crossed!


TGIF folks!!

E$ price action unfolded as forecast and the following technical signals have reinforced the bullish scenario:
1. Bullish piercing candlestick - a reversal signal
2. E$ closed high enough for an open today to be above upper trend line
3. There are a couple more signals but since market has already taken off, let's stay focus on the profit taking part which is more crucial.

By the way, as I am typing, the last known stop at 1.2930/40 has just been cleared.

Taking the recent high of 1.31718 and yesterday's low of 1.2828, the fibonacci retracement ratio are as follow:
61.8% - 1.3040
50.0% - 1.3000
38.2% - 1.2960
One should mark down around 10 pips as a guide for profit-taking basing on the above 3 levels unless you are seated right infront of the screen to monitor the price action. Another level to watch is 1.2975 and 1.3100 (news induced). In the next couple of weeks, we may be stucked within 1.2828 to 1.3100 as E$ consolidates further.

Trailing stop should be moved to 1.2880 and adjusted accordingly through the day.

All the best and have a great weekend ahead!!
E$ Daily chart - The signals

Thursday 27 September 2012

Though still trapped, but....

Good afternoon folks!!

After spending almost 8 daily sessions of unwinding from the overbought condition, E$ has probably found a base after flushing out a bunch of sell stops to 1.2835 low overnight. It looked precarious when it was near the support trend line yesterday as momentum was all pointing down. 1.2800/20 ("Caught in between...", 26 Sep Wed) is crucial, as it is a pivot level and breaking and closing below could end all hopes for any meaningful rebound. I must admit that I felt uncomfortable because I still have the conviction to buy the E$ on dips for 1.3000 by this week. All I needed was for E$ to hold that line in the sand for several hours and the probability of a rebound would have increased significantly. A couple of technical signals kept my hope alive. They are the bullish divergence in the intraday momentum and the bullish cross between the MA21 & MA200 and MA50 & MA100 on the daily chart. The following economic data should trigger a whipsaw market allowing for opportunity to buy the dip; German Unemployment Change (1555hr Sin/HK), Eurozone Retail PMI (1610hr) and finally US Durable Goods + GDP (2030hr).

Stop loss orders can be found at 1.2780, 1.2800, 1.2825 & 1.2930/40 and large limit order at 1.2835.

Technically, intraday indicator is at o/b level as a result of the overnight rebound. Momentum has also reversed from down to consolidation with scope for a move higher. Lower TL support is at around 1.2840/50 and upper TL at 1.2925/30 (see chart below).
From here, I expect a possible sell-off from around current level of 1.2890 on the back of the european data and then market rebound off 1.2840/50 and test 1.2925/30 during the NY session. I will look to buy dip with risk to 1.2790 or 1.2760 for a break to 1.3000 by Friday.

All the best!!
E$ Daily chart - Supported on lower trend line 

Wednesday 26 September 2012

Caught in between....

Good morning folks!

I must admit it is getting boring now as the range tightens to 1.2890 - 1.2950 today (see chart). Yesterday, market talk has it that there was gamma interest on either side of 1.2900 with expiry rolling off at NY cut. However, from the looks of things, it seemed like it may not have expired yet. Frankly, its getting really tough now and getting in the market is more like betting in the casino.

Order book is as follows with stops at 1.2810/00, 1.2870 & 1.2888/90 and large limit orders at 1.2850/55 & 1.2880/85.

Technically, intraday indicator is at o/s level though not extreme. Momentum is flat with a slight hint of turning up coupled with mild sign of bullish divergence. Daily o/b condition continues to unwind as E$ closed lower on a day to day basis and weekly momentum is still pointing down. If someone point a gun at my head now, I would place a 55/45 chance to go long E$ to retest 1.3000 today. However, I prefer to wait out for clearer signals before reacting.

All the best, commandos!

Update1: E$ is heading towards the critical 1.2800/20 support and momentum still seem to be pointing down for now (current 1.2840). A break and close below that level would expose E$ to a possible test of the 1.24/25 region. No recommendations for now. Update will be delayed tomorrow.
E$ 4hourly chart - Awaiting to break out

Tuesday 25 September 2012

Time up!

Good morning folks!!

Indeed the only motivation yesterday was to seek out the stops at 1.2920 and 1.2900. But E$ managed to hold 1.2891 despite rumours of stop loss orders in the 1.2880/85 region. Heard there was reserve money interest and E$ bounce off to close the day at 1.2930.

Since there isn't much to report on, I shall share with all my longer term view of how I see the E$. E$'s daily indicator which was in the o/b zone is starting to unwind following these recent days consolidation and I expect this to continue for another couple of weeks within 1.2800 - 1.3170. I do not have any technical indications of an end to the E$'s bull trend. Instead, I see a healthy consolidation after the recent parabolic rally for the next phase of the bull run to tackle the tough resistance band of 1.3400-1.3500. The long term dilution in the value of USD through QEternity is far reaching and I am not surprised to see E$ heading towards 1.4000 in the months ahead.

Order book is quite empty. The only ones are 1.2880/85 for stop and large limit buy at 1.2850/55.

Technically, intraday indicator has gone into o/s levels and market should continue to unwind that condition. There are also signs of bullish divergence and this will re-enforce my view of buying the dip yesterday. Momentum is also starting to turn from consolidation to up. No change in the expected range, 1.2890/910 to 1.3040.

All the best and tomorrow's update will be delayed. Cheers!
E$ 8Hourly chart - Staying above

Monday 24 September 2012

Stop seeking!


Goood Monday morning folks!! What a weekend!!! Hamilton looked set to win the Singapore F1 GP but his car failed him only to hand the trophy over to Vettel who drove a flawless race. On golf, when everyone was betting between Rory or Tiger to win the FedEx Cup, Brandt came from behind to walk away with the US$11mil paycheck!

Back to the market on Friday, E$ was rejected around the 50% Fibonacci ratio mark after printing a high of 1.3048 amid a very volatile environment, all due to poor liquidity. Focus remains fixed on Spain but the Troika will take a week break from negotiation and that should switch its mode to range consolidation for now with market seeking out stop loss orders in the process. Only potential mover to look forward to is the German Ifo business climate data at 1600hrs (Sin/HK).

Latest update of stop orders:1.2900 & 1.2920 and large limit orders are heard to reside at 1.2850/55, 1.2920, 1.3045/50, 1.3075/85 & 1.3100.

Technically, intraday indicator is in o/s levels though not extreme. Intraday momentum is suggesting range consolidation. Today's opening below 1.3000 should put E$ under initial pressure to test the 1.2900/20 support level and this is reinforced by the inside week bar from last week against the week before last (see chart). If that support band holds, we should see E$ gets suck back into the range.
For today, I expect range to be contained between 1.2890/1.2910 to 1.3040 (1.3100 news induced). I prefer to buy on dips with risk to 1.2840. Always remember to use trailing stops to protect your gains.

All the best and have a great week ahead.

E$ Weekly chart - Retesting trend line?

Friday 21 September 2012

Have we found the base?

TGIF friends!!!! Singapore F1 GP weekend starts today, that's why I woke up at 5.30am to prepare this blog and hopefully make my budget for today before I head out  :)

Market flushed out most of the weak longs on this sell-off and touched a low of 1.2919. Bullish divergence has emerged and this signals a potential near term base and expect E$ to rebound into the defined range of 1.2910/20 to 1.3160/70 for now. I may have wasted an opportunity to go long the E$ the day before yesterday but the sell signal was consistently reliable and in the end was well rewarded. Admittedly, targeting E$ to hit 1.28ish was an extreme call to mentally prepare myself in the event of an overwhelming piece of news. Nonetheless, I am still very happy with my trade.

From yesterday's book, the only stop left can be found at 1.3060. Large limit orders were heard to reside at 1.2855/60 and 1.3020/30.

Technically, intraday indicator is close to o/s levels. With E$ hovering around the lower band of yesterday's range and with momentum turning from down to consolidation, it offers E$ some room towards the upside. E$'s ability to close at 1.2968 yesterday is a positive signal and this should provide some kind of support for at least the first half of the trading session.
For today, I believe the E$ should retrace this week's losses targeting the Fibonacci ratio levels, particularly the 61.8% mark. Risk should be contained to yesterday's low.

All the best and have a great weekend ahead.... one thing for sure, I know I will!!  :)


E$ Hourly chart - Fibonacci Retracement Ratio

Thursday 20 September 2012

For solid footing....

Good morning folks, one more day to the Singapore F1!!!

Indeed, E$ came off to the support level at 1.2990/1.3010 and it subsequently rebounded to a high of 1.3076. My recommendation to buy dip was called off because a conflicting bear technical signal emerged and I am willing to forego an opportunity than to make an exception and in the process create confusion in my calls in the future. Though E$ bounced off the low of 1.2993 during the early NY session, it has not re-captured the pivot at 1.3085 where it could have opened its door for the recent high to be retested.

Order book is getting busy again and stop loss orders were residing at 1.2970/80, 1.3085, 1.3115/25 & 1.3180. Large limit orders were reported at 1.2930/35, 1.2980, 1.3165/75 & 1.3200.

Technically, E$ closed a 'doji' yesterday and it indicates that market is uncertain and took a neutral stance closing at or near its opening price. Intraday overbought/oversold indicator is neither in extreme zone though the daily and weekly ones are in o/b level. Momentum is starting to point to consolidation > down. As I have mentioned in 'Comfort zone' (19 Sep Wed), I expect further consolidation before its next wave higher. But with the latest signal, it has increased the probability of a deeper correction into 1.2770/1.2800 before it resumes its next bull target of 1.34/35.
For today, I prefer to be on the short side with risk to 1.3090 and looking at 2 levels for profit-taking, 1.2970/80 and 1.2850 (looks abit far tho :))

All the best!

E$ 8hourly chart - Recent price action too steep

Wednesday 19 September 2012

Comfort zone

Good Wednesday morning, folks!!

E$ eased lower to 1.3029 overnight, albeit in a very corrective manner. What I know is the only fundamental driver for today is the US housing starts and existing home sales data to be released at 2030 and 2200hrs (Sin/HK) respectively. In the days ahead, price action should be consolidative as we have entered the band where somehow the market spent lots of time staying within in the first 4 over months of this year. The easy money in going long E$ is behind us and in the days ahead, one has to switch that mentality to more range trading mode.

Interestingly, I have the latest update on the noteworthy market orders. Stop loss orders can be found at 1.3000/20, 1.3075/80 & 1.3095/100 and limit orders at 1.2850/55, 1.2930/35, 1.2980, 1.3000/20 & 1.3170/75.

Technically, shorter term indicator is at o/s levels with momentum starting to turn from consolidation to up. However, on the daily basis, E$'s recent price action which had gone parabolic would still need some more time to consolidate before it can attempt another sustainable move higher. If not, any sharp rally above the recent high is susceptible to a quick snapback.

Overlaying the order book with the technical tool readings, I would still maintain a range within 1.2990/310 - 1.3150/70 as the highest probability scenario. However, I prefer to trade from the long side for today buying on dips.

All the best!

Update1: Current 1.3010... momentum has turned down and I will hold back buying for now.

E$ Daily chart - Comfort zone for E$


Tuesday 18 September 2012

Take a break, have a ........

Good afternoon folks!!

Walking 18 holes under 35 degrees celsius (that's what it felt like) was really a killer! Boy, am I glad I survived. Guess its time to head back to the gym.

Monday was basically sideways consolidation with price remaining capped as E$ had gone parabolic on last Friday. Now that the Fed's QEternity is behind us, market may start to turn its focus back to the eurozone, specifically on Spain. For today, attention should be on the German ZEW economic sentiment data at 1700hrs (Sin/HK) which the market has factored in an improvement at -19.4 from the previous month of -25.5.

My source did not update the CFTC speculative account report but intuitively one would have expected a further reduction in the net E$ short positions.

Stop loss orders are residing at 1.3050/60, 1.3070 & 1.3180 and noteworthy limit orders at 1.3060 (Asian sovereign?), 1.3170/75, 1.3200 & 1.3250.

Technically, short term intraday indicator is at o/s level but longer term still has quite a bit of mileage. Important to note is that bearish divergence has emerged and that has increased the probability of a near term top already in place. Intraday momentum has turned from up to consolidation to down and the weekly also suggest a potential consolidation after recent weeks of the sharp rally.
For today, I expect a trading range of 1.3000 - 1.3140 (both on first test). The baseline being the neckline as drawn in the chart below. It would actually have been an extension from yesterday's sell rally call. Just pay abit of attention on the price action when market nears 1.3050/60. If unsure, always prudent to scale out in 2 batches.
E$ Daily chart - Neckline turned support
All the best!

Monday 17 September 2012

Stretched....

Good Monday morning, folks!!

Good weekend, everybody? I will be really looking forward to this coming one... its the Singapore F1 GP Night Race weekend here at the Marina Bay street circuit with Katy Perry and Maroon 5 to spice up the party!!!

Last Friday, the market exceeded my expectation and extended itself to go parabolic tripping the  38.2% Fibonacci level (see chart) to print high of 1.31688. Based on time and price and the resistance that are in place, E$ has probably run its course for this wave as mild bearish divergence emerges. The probability of sideways consolidation and then correction lower has increased significantly and a pullback into 1.3000 is becoming highly plausible. Having said that, the underlying bull trend remains very much intact and this consolidation is seen to be healthier for its next wave into the 1.34ish region.

I have not received the CFTC speculators account data just yet but will update all tomorrow if I do get them. Strangely, the stop loss order book is empty. I can imagine if there is no buy stops but even sell stops are not significant enough to be reported. Very likely, the buy stops have all been flushed and the longs have taken profit and therefore no sell stops are required anymore. Noteworthy limit orders can be found at 1.2850/55, 1.2930/35 and 1.3200.

Technically, daily indicator is at extreme o/b condition. Shorter term momentum has turned from up to consolidation but the longer term is still pointing firmly up. Sign of mild bearish divergence has emerged and this should alert us to be careful going overly long at current levels. For today, the expected trading range is between 1.3050/60 to 1.3180/1.3200 on first test and I prefer to be fading into rallies, provided 1.3050/60 is not tested first.
E$ Weekly - 38.2% target reached
All the best and have a great week ahead. Update of the blog will be delayed tomorrow as I have an early tee-off in the morning.

Friday 14 September 2012

QEternity.....

TGIF folks!!

Guess I don't have to repeat what the Fed's decision was in details here as you probably have already read it somewhere else. Gathering from the people that CNBC interviewed last night, the consensus has it that they were surprised by the 'unlimited' amount of QEternity (can I have a patent right on this word, Apple?). Whether is it politically driven, I am not here to discuss that. The fact is, the equity markets love it which also correlate to a weaker dollar. Do not underestimate the effects of Fed's latest decision, it can be more far reaching than we think. Last night's price action was relatively disciplined and controlled considering how big the news was, as E$ crept higher forming higher lows and higher highs by the minute. Based on time and price, it did not over-extend itself. This is a more sustainable price action than if it had spiked and turn exponential towards 1.3000.

It all began with market first turning lower to flush some weak sell stops earlier in the evening before turning around to clear the buy stops at 1.2940, 1.2950 (large), 1.2975 and 1.3000. At this moment, I have no updates on the outstanding stop loss orders.

Apparently, market is still keen on selling the E$ on rally around 1.3000, which of course I was flirting with that idea too. But having seen last night's price action and the renewed upward momentum, I would rather stay friendly with the underlying trend. Last night, I executed according to scenario 3 and bought E$ on the dip and took profit just before Bernanke spoke. Sweet again!

Technically, intraday to daily indicators are pointing to extreme o/b condition but I have mentioned before that in a trending market, these indicators can get 'stucked' right up there. Upward momentum is strong and the step fashion price action signals strong underlying bid tone. My initial target of 1.3000 has now been achieved (Breakout, 10 Sep, Monday) and E$ should be eyeing at the resistance band around the 1.34ish levels (see chart, the eclipsed area) which also represents the 50% fibonacci level.
Today's expected trading range from 1.2940/50 to 1.3050/60 and I prefer to trade from the long side. Risk should be kept to 1.2850.
E$ Monthly chart - Reversal
All the best and have a great weekend!!

Thursday 13 September 2012

Euro bears, wait!

Good Thursday morning folks!!! Looking forward to tonight's major risk event, the FOMC rate decision and statement?

It doesn't matter if I understood German or not as the constitutional court read out the verdict yesterday. Right infront my trading screen, I saw the price changed so rapidly, I just needed to confirm the big figure was right. The way the prices gapped reminded me so much of those good old days when central banks intervened in the market. I stucked to my guidance in 'The grind...' (12 Sep Wed), sold the E$ at 1.2873 earlier, waited and the verdict came, E$ plummeted and bought back at 1.2819,  54 pips in a matter of seconds. Sweet! Stayed out for the rest of the day, even though I foresaw higher E$, as the technical signals were thrown out of rhythm as a result of the irregular price action.
These couple of weeks, market has primed itself for QE3 and its apparent that it has been factored into the current price.
So 3 possible scenarios for tonight:
1. Fed pushes for QE3 and the amount is within market expectation > E$ rallies on knee-jerk reaction, then sell off on 'Buy rumour, sell facts'.
2. No action from Fed and continues to stay vigilant > sharp sell-off in E$ right away.
3. Fed pushes for QE3 and amount exceeds expectations > E$ extends its rally through 1.3000 and correction is delayed.

On the order book based on yesterday information: Stop loss orders were found at 1.2950 (large) and 1.2750. Noteworthy limit orders at 1.2950 & 1.3000.

Technically, indicators are back into o/b levels with the daily one at extreme. This has further increased the probability of a snapback as price action is going exponential. Bearish divergence has emerged and that adds on to the bear camp. However, another study of momentum is still pointing firmly higher, which I can conclude that the market is potentially susceptible to a near term correction within a bull trend. This makes sense as the anticipation of US' QE3 will be over after tonight and focus could be thrown back to the eurozone. However, do note that market is capable of extending its 5th wave (of bigger 3rd), normally driven by overwhelming fundamentals. In a situation like today, its wise to step back and react, rather than to pre-empt the market. I am mentally prepared for E$ to fall back to 1.2710/30 in case of disappointment, a level I will be keen to buy into.
On a regular trading session, I would bet on a 1.2830/40 - 1.2990/300 range but because its FOMC Thursday, the expanded range would be 1.2710/30 - 1.3040/50.
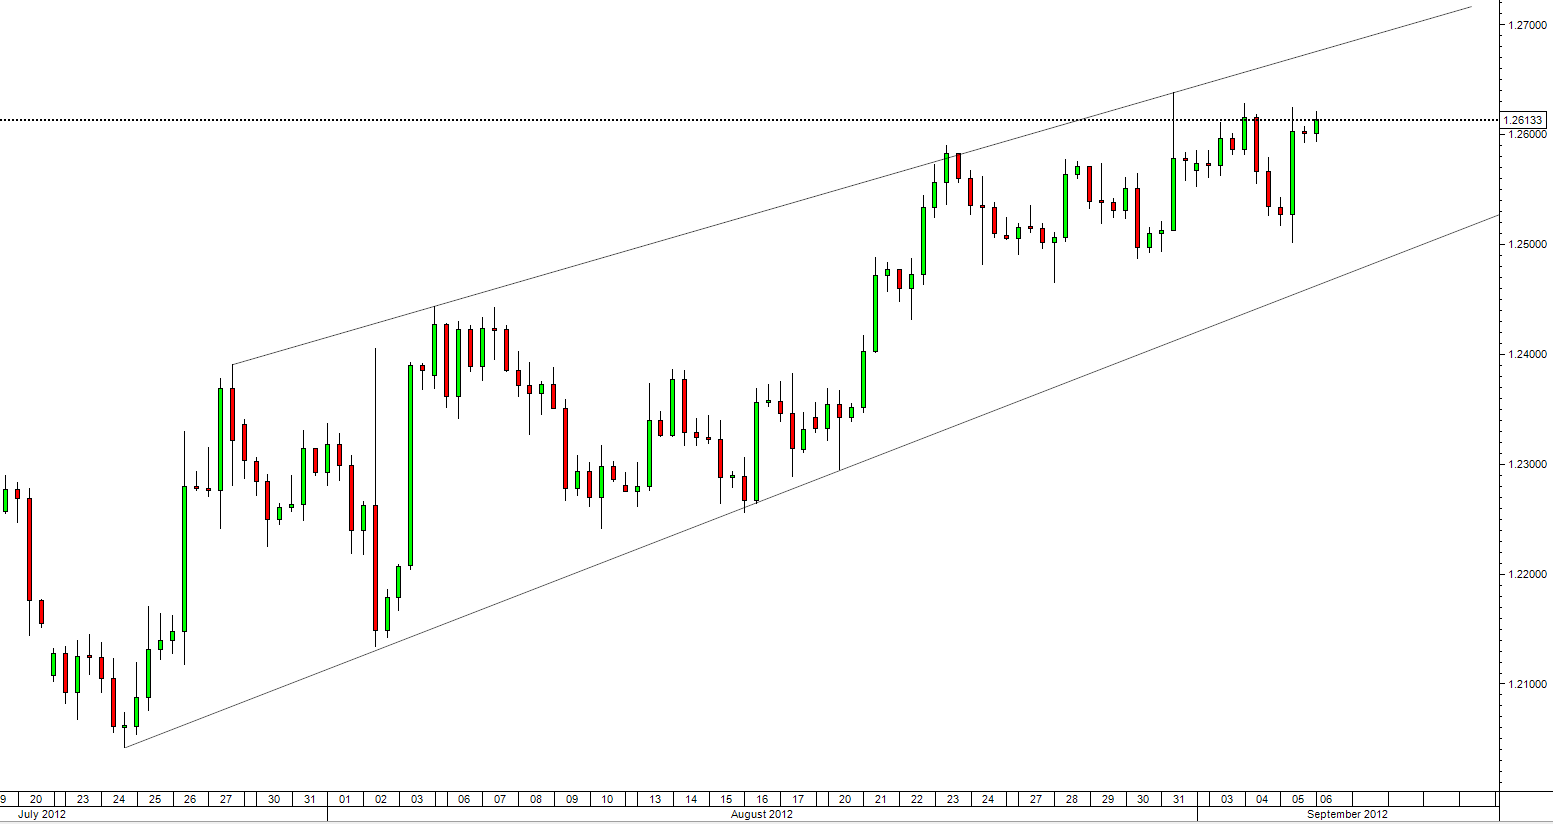
E$ Weekly chart - Trendline to trendline 
All the best!

Wednesday 12 September 2012

The grind.....

Good morning folks!!

Moody's report on potential US credit rating downgrade gave market the impetus to cut short E$'s consolidation to flush buy stops which were lined up to 1.2855. High had been 1.2872. Market should continue to be sensitive to E$ positive fundamentals as the main trend remain bullish.

On the stop loss orders, most buy stops have been triggered leaving only 1.2875 outstanding for now. Sell stops have built up starting from 1.2750, 1.2710/00 and a large one at 1.2680. This scenario has increased the probability of a near term top (not to be analyzed in isolation but in conjunction with other  technical indicators).

Technically, intraday to daily indicators have all moved into the o/b territory. Shorter term intraday momentum is starting to turn from up to consolidation while the longer term ones are still pointing up. Important to note is that bearish divergence has emerged, though still a little early to confirm but one has to be mindful as it has increased the probability of an imminent near term top. Having said that, there is no indication of a major trend reversal but instead a correction of the recent rally.
Someone asked me what it meant by 'first test' in the range. It simply means that price is expected to bounce off the support or resistance on its first test only but will be vulnerable to breaking out on second test. An example was yesterday's price action where E$ touched 1.2819 and thereafter fell back to 1.2768 (would have at least given you a comfortable 30pips profit range) before it rallied towards 1.2872 on the E$ positive news.
In summary, daily momentum remains strong and have not demonstrated a 'fracture' yet, I continue to see a grind towards the former neckline around 1.2980/1.3000 before a more elaborate correction kicking in. Therefore, the impulsive or easy money moves are probably over and we are in the stage where there will be more choppy price actions.
For today, I trade the range of 1.2800 to 1.2900 (whichever comes first on first test). Risk should be limited to 1.2750 for the longs. Stay nimble and remember never to give all your profit back to the market. Have the discipline to institute trailing stop.
E$ Daily - Neckline support turn resistance
All the best!

Tuesday 11 September 2012

Crucial signal....

Good morning folks!

Market went into a limbo yesterday following Friday's surge as focus is turning back to the eurozone in the meantime before Thursday's FOMC decision. Come Wednesday, if it is not postponed, the German constitutional court will announce their decision on the legality of the ESM. If its found to be illegal, it will be short term E$ negative.

Admittedly, I must smack myself for missing such an important signal last Friday (see chart below) as I was distracted by a couple of other technical signals. This break is crucial and it does affect my decision-making when combined with the other technical tools.  :(

On the stop loss orders, we have a nice 2 ways pattern: 1.2855, 1.2850, 1.2825/20, 1.2710/00 and 1.2690. Noteworthy limit orders can be found at 1.2840/35 and 1.2710/00.

Technically, intraday indicators have unwound itself off the extreme o/b condition amid shallow correction. Shorter term intraday momentum indicators are pointing to further consolidation though longer term indicators are still pointing firmly up. I would expect further consolidation within 1.2700/20 to 1.2820/40 for now with an eventual break on the upside towards 1.3000.
For today, trade the range on first test with tight stops.
E$ Daily - Important break to the upside
All the best!

Monday 10 September 2012

Breakout!

Goood Monday morning, folks!! What a weekend with Lewis Hamilton winning at the Monza and Rory walking away with the BMW Championship cup. I am also happy to see Tiger finishing amongst the top in the leaderboard on Sunday.

Back to the market on Friday..... hope someone caught part of the move up? I was expecting E$ to consolidate into the US employment numbers but the rally started sooner than expected during early Europe and momentum was strong into the US session all the way into the close. High so far has been 1.2817, achieving my initial target of 1.2800 way ahead in terms of timing ('Momentum is the word....', 6th Sep 12). I have yet to go short on E$ as it did not pan out as expected. Focus this week is on the FOMC rate decision and statement, on Thursday trading day (0030hr and 0215hrs Sin/HK, 14 Sep Fri).

CFTC speculative accounts revealed that net short position has increased modestly to -102,306 from -101,561 from the week before. Just for comparison purpose, the record net euro short position was at -214,418 contracts, seen on 5 Jun 12. Therefore, market is not exactly caught very short but it still does give the bulls incentive to squeeze out the rest.

Technically, intraday indicators are in the extreme o/b levels, though it can remain 'stucked' there in a trending market. Intraday momentum is starting to turn from up to consolidation but the daily upward momentum remains firm. With Friday's strong close on daily and weekly basis, initial follow-through bullish momentum is expected. Though intraday momentum has thrown out a bearish divergence signal on this recent wave up but I feel it is still premature. If market consolidates here and makes another spike up along with another divergence signal, only then will it go into a deeper and more elaborate correction. Having said that, underlying uptrend momentum remains strong and E$ should target 1.3000 next.
For today, if 1.2820/30 is not tested first, look to buy the dip. 1.2750/40 support with stronger at 1.2710/00 and 1.2840/50 first initial resistance.
E$ Daily chart - E$ broke out of channel
All the best and have a great week ahead!

Friday 7 September 2012

Stating my case...

Good morning folks, its Friday!!!

Super Mario did it again sending E$ to a new recent high of 1.2652 after July's low of 1.20426. However, fund and sovereign supply capped the move backed by stronger US ADP data. E$ then whipped around taking out both short term longs and shorts before stabilizing around 1.263ish.

On the order book, stop loss orders are starting to build up again from 1.2490/80, 1.2550 and 1.2670/80. Noteworthy limit orders were heard to be residing at 1.2580, 1.2650 and 1.2670/80.

Technically, intraday indicators are all in o/b levels and probability gets lower for price to sustain after another rally, i.e. a potential spike higher before it turns lower again. Shorter term momentum is starting to turn from up to consolidation though the longer term continues to point higher. Important to note too is that there is an early sign of bearish divergence though still premature to confirm. The bullish piercing pattern on the monthly chart strengthened the case for higher E$ but do note that I expect E$ to at least test the lower band of the channel first before it turns. This is supported by the fact that EURAUD's recent rally has stalled and consolidation to take place.

In summary for today, if E$ consolidates around current levels and rally on US employment figures, I will be looking to fade into that price action (highest probability scenario). 1.2710/20 to cap with stronger resistance 1.2760/70 and 1.2560/50 support and stronger at 1.2490/80.
E$ Monthly chart - Reversal pattern
All the best and have a great weekend!

Thursday 6 September 2012

Momentum is the word.....

Good Thursday morning folks, I'm back!!! Was watching CNBC..... Bill Clinton spoke so well and no wonder he is one of my favorite US Presidents  :)

Finally back to the market.... admittedly, I have lost touch with the fundamentals for the earlier part of the week but focus should now be on UK's rate decision, MPC and ECB statements this evening. Highlight of the week will be tomorrow's US employment data.

Stop loss orders from yesterday's order book remains very light with only one at 1.2490/80.

Technically, intraday indicators are pointing at o/b condition though intraday momentum has turned higher. Daily momentum has also turned higher as a result of the higher trading range of 1.2465 to 1.2635 in the past eleven days, after it broke out of the consolidation at 1.2370. However, I am not
too enthusiastic in jumping into the bullwagon just yet. Somehow the stop loss orders stand out as a beacon and it is nestled nicely at the lower band of the channel where it may just draw sellers to trigger that and retest the trend line before rebounding. With the current levels in the range of technical tools, I can think of 2 possible scenarios:
1. E$ makes another push higher from around current levels but cap at 1.2710/20 and then turn around for the lower band.
2. E$ falls towards lower band first, takes out the stops and then turn higher towards 1.2710/20.
With that in mind, I prefer to position myself only when market nears the 2 boundaries.

By the way, underlying momentum remains bullish for the E$ and I believe we can see E$ testing 1.2800 in the coming weeks. ('Happy days ahead for EUR?' dated 15 Aug 12)
E$ 8hourly chart - Bullish channel
All the best!