Friday 26 April 2013

E$ caught short once again....

Choppy price actions continue to plague the market as we move into the final trading day within the full moon zone. Market was caught short with the ECB rate cut anticipation but right after a series of buy stops were flushed (intraday high: 1.3094), stop loss hungry hunters turned around and sold the E$ down to 1.2988 on the back of the same story.
Following the steep overnight sell-off, market could have once again be caught short the E$. Based on the available information in the order books and technical resistance/support, the path of least resistance could be up with possible clusters of buy stops residing just above. The stop order at 1.2950 though tempting, has to content with real money and reserve managers' buy orders from 1.2950 to 1.2980.

In hindsight, knowing it was full moon zone, I should have just shared my forecast on that remote possibility of E$ falling back to 1.2990 yesterday..... it materialized!!!
Scenario 1:
E$ to hold 1.2980/90 and rally to touch 1.3130/40 before easing to close the week below 1.3100.

Scenario 2:
E$ to hold 1.2980/90 and consolidate within 1.3000 to 1.3050/70 with choppy price action.

Asia order book:
Stop loss: 1.2950/40, 1.3060/70 and 1.3115/30
Limit: 1.2980-50, 1.3060/70 and 1.3115/30

Primary trend: Bullish
Intermediate trend: Bearish
Minor trend: Upside bias from current level (see above scenarios)

Technically, shorter intraday indicators are in o/s level (not extreme) with the longer intraday just coming out of the o/s condition with lots of room on the upside. Intraday oscillator indicators are all pointing to consolidation within 1.2980/90 to 1.3050/70. As I type, E$ is already shortcovering. Will update later.
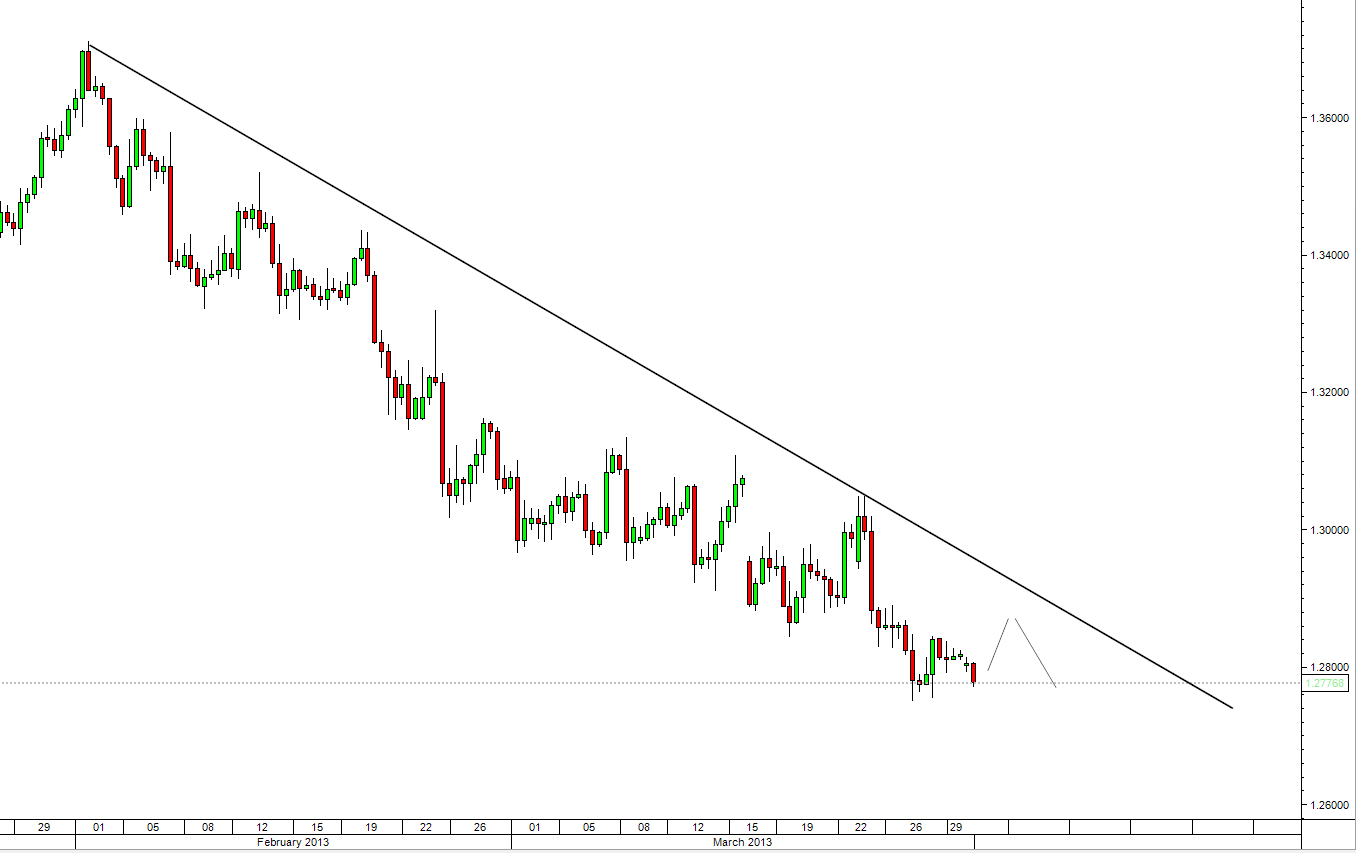
E$ 4-hourly chart - Technical sign of uncertainty at current level

Thursday 25 April 2013

Asian sovereign interest to dominate....

E$ reacted as in Scenario 1 (German Ifo to stimulate...., 24 Apr Wed) but with a low of 1.2954 before the rebound. High so far has been 1.3061 with the offer at 1.3065 capping any advance. Market chatter that a sovereign name is at the offer.
Just picked up reports that the S.Korean and Thai central banks have been active intervention USD buyers against their own currencies and these USD could well roll into E$ recycling demand later in the day.
US weekly jobless claims at 8.30pm (Sin/HK) should be closely watched in a relatively light economic data day.

Asian order book:
Stop loss: 1.2950/40, 1.3005/00 and 1.3070
Limit: 1.3065

Primary trend (> 3mths): Bullish (View negated if 1.20426 breached)
Intermediate trend (2wks - 3mths): Bearish for possibly 1.2850/70 (View negated if 1.32012 breached)
Minor trend (< 1wk): Bullish for 1.313/40 (View negated 1.29534 breached)

Technically, shorter intraday indicators are in the o/b zone though not extreme whereas the longer intraday still has more room. Intraday upward momentum remains strong and 1.3050 is the pivot where it can open E$ up to 1.3130/40. Currently, 1.3030 is providing support with stronger at 1.2990. Next level of resistance stands at 1.3075/85 and 1.3130/40. For those who were still long on yesterday's recommendation, don't forget your trailing stop.
E$ Daily chart - Early phase of the counter-directional correction

Wednesday 24 April 2013

German Ifo to stimulate....

Full moon effect came early indeed as evident in the price actions since yesterday (the erroneous tweet included). Overnight, there were signs of a USD resurgence across the board and one has to take note of its indirect impact via the EURxxx on E$ in the coming days.
The German Ifo Business Climate number today will be very important as it can steer market's expectation of a possible rate cut by ECB comes next week.

Since we are in the full moon zone, I dare to put out 2 possible scenarios in anticipation of the economic data at 4pm (Sin/HK).
Scenario 1: Weaker than expected
E$ capped below 1.3030 and fall towards 1.2930/40 before a sharp reversal for possibly 1.3140/60 in the days ahead.
Scenario 2: Stronger than expected or within expectation
E$ holds 1.2960/70 and rally for 1.3140/60 in the days ahead.

Asia order book:
Stop loss: 1.2950/40, 1.2970/62 and 1.3130
Limit: No noteworthy orders

I have revamped this part here as I re-calibrated the time period to better define the respective trend.
Primary trend (> 3 mths): Bullish (View negated if 1.20426 breached)
Intermediate trend (2 wks to 3 mths): Bearish for possibly 1.2850/70 (View negated if 1.37106 breached)
Minor trend (< 1 wk): Bullish (Limited downside to 1.2930/40. Susceptible to short squeeze)

Technically, intraday indicators are close to o/s condition though not extreme. Shorter intraday oscillator indicator is suggesting consolidation which at current level would mean more upside bias. Longer intraday oscillator indicators are still pointing lower for now. Based on the event risk this afternoon, it will be prudent to react accordingly based on the 2 possible scenarios.
E$ Daily chart - Possible scenario

Tuesday 23 April 2013

Full moon comes early!!

After spending yesterday within the inner band, E$ broke out into the expanded range, ref "Not time yet....", (22 Apr Mon). Choppy price action normally characteristic when within the full moon zone (starting tomorrow) is already happening today. Stronger French Flash Manufacturing PMI number took E$ to the day's high of 1.30838 and half an hour later, the weak German Flash Manufacturing PMI sent E$ reeling to the day's low so far at 1.2973. The reported large sell stop below 1.2970 seems to be the magnet for now but like what I mentioned yesterday, I am sceptical and not too sure if its trying to draw in more sellers for the "buyer" to accumulate. If this level holds and rebound above 1.3000 in the next 3 hours or so, the probability for a move back to 1.3040/50 will be high. However, if 1.2960/70 goes, we may see a quick drop to the next strong support at 1.2920/30 (61.8% fibo ratio). Either way, I can't get too bearish around current level.

Europe order book:
Stop loss: 1.2950/40, 1.2970 and 1.3130
Limit: 1.3195/00

Primary trend: Bullish
Intermediate trend: Bullish
Minor trend: Bullish (but must await technical confirmation)

Technically, intraday indicators have all slipped into o/s territory though not extreme yet. With the sharp sell-off earlier, intraday oscillator indicators are all pointing firmly lower. Currently, market is supported by the DMA21 (red) which happened to be the 50% fibonacci retracement level. Expect consolidation between 1.2970 to 1.3010 for now. Probability for another test on the downside is high as long as the momentum indicators are pointing down. For me, I will stay patient for the next 2/3hrs for confirmation of changing momentum or take at chance to buy if E$ falls through to 1.2920/30 with a tight stop and take profit around 1.3030/40.

E$ Daily chart - Touched 50% fibo ratio


E$ Daily chart - Finding support at the DMA21 (red)

Monday 22 April 2013

Not time yet.....

As expected, E$'s Friday price action remained very choppy lacking direction ahead of the G20 weekend after being rejected close to the 61.8% retracement level. When silence means consent, USDJPY gapped up during the opening hours with E$ following suit. But the E$ gap was subsequently closed with market trading within a tight range for now. Amid the quiet environment, there are chatters in the market that sovereign and semi-official interests are lurking around 1.3000 and that should discourage aggressive selling when closer to that level. There is also mention of a large stop loss order around the vicinity of 1.2970/80 but I remain very sceptical. Smells more like a venus trap than anything else.
Do note that we will be trading into the full moon zone starting from Wednesday. As of now, I do not have any information of any major risk event/s during that period except for Wednesday's German Ifo Business Climate number due out at 4:00pm (Sin/HK).  

CFTC COT report: Speculator accounts showed a net euro short position of -29,764 vs -50,858. Spec accounts had a net yen short of -93,411 vs -77,697. Since July 2007, the largest net yen short was at -94,401 contracts which we are very close to now.

Asian order book:
Stop Loss: 1.2970, 1.3000 and 1.3125/35
Limit: 1.2990 and 1.3000

Primary trend: Bullish
Intermediate trend: Bullish
Minor trend: Mixed (consolidation mode with no breakout in sight for now)

Technically, shorter intraday indicators are in neutral zone while the longer intraday ones are just turning up from o/s levels. Intraday oscillator indicators are gradually converging to suggest further range consolidation but still premature of a breakout at this point in time. Expected inner band range within 1.3000/20 to 1.3100/20 with expanded band 1.2960/80 to 1.3140/60. Clearly market is drifting around the neutral zone and as far as my trading philosophy is concerned, getting in now is as good a probability as tossing a coin. To be honest, there is no opportunity for good R/R payout today. Trading strategy has to switch to very short term momentum pips scalping when nearer band extremes.
When there is no clarity with minor trend, fall back on the intermediate.

E$ 2-hourly chart - Rejected at 61.8% correction level
Maintenance of the fibre optic infrastructure in my area kept me away from market last Friday.

Thursday 18 April 2013

Engulfing all the way...

Overnight comment from ECB Weidman sent E$ down to an intraday low of 1.3001. This resulted in 3 consecutive days of engulfing candlestick pattern, a very rare occurrence indeed!! Fundamentally, with his comment that ECB might adjust interest rates if new information warrants it, it has become a perfect storm for the E$ as on the other hand, the US Beige book was interpreted as more on the hawkish stance. Though the underlying tone is bearish, the easy money going short E$ is over and we are in the zone where we should be mentally prepared for whipsaw and volatile price actions.
Event risk today is the Italian Presidential election.

Primary trend: Bullish
Intermediate trend: Bullish (until 1.27447 is breached)
Minor trend: Counter-directional consolidation before another wave lower (but can't get overly bearish when nearer 1.2920/50)

Asia order book: (no update on the European book yet)
Stop loss: 1.3205
Limit: 1.3195/200 and 1.3220

Technically, shorter intraday indicator has unwound its o/s condition though the longer intraday is still in o/s levels (not extreme). Shorter intraday oscillator indicator indicates consolidation but longer intraday momentum is still pointing lower. One has to take note that E$ has breached several technical levels and coupled with a weak close yesterday, spillover momentum should take us another wave lower. Expected range 1.3060/80 to 1.2930/50.
E$ Daily chart - 3 consecutive engulfing pattern days!! Last one wins....

E$ Daily chart - Rejected at upper band, testing lower?

Wednesday 17 April 2013

Bear to bull trap....

It seems like there was this deliberate effort to draw in more speculative shorts in euro this week. Monday's price action (bearish engulfing candlestick pattern) set up the first bear trap and encouraged a further build up of buy stops above 1.3100. The second bear trap was the initial sell-off post the weaker than expected German ZEW number, first falling to 1.3028 before turning around sharply. A series of notable stop loss orders were triggered up to 1.3170 and 1.3180. Suspected large option barrier at 1.3200 was tripped too as high printed was 1.3202. Finally, I feel vindicated as I have been mentally prepared for this squeeze for the past few days, except that it surpassed my target marginally. As of now, market attention may soon turn to the sell stops that have been building up since the past weeks.
Expect tight sideway consolidation for time induced weakness in price action as supports move higher to form resistance.
Fundamentally, with much anticipation of Fed pulling the plug on further QE earlier than expected, E$ should trade softer into tonight's Beige book at 2am (Sin/HK Thu).

Primary trend: Bullish
Intermediate trend: Bullish
Minor trend: Bearish (Probably completed the 5 wave and has increased the risk for downside from here)

Asian order book:
Stop loss: 1.2990, 1.3020/00, 1.3110/00, 1.3140 and 1.3205
Limit: 1.3020/00 and 1.3220/28

Technically, intraday indicators are in the o/b zone though not extreme. Shorter intraday oscillator indicators are indicating upside momentum waning and price action suggest consolidation between 1.3150/60 to 1.3200/10. Longer intraday oscillator indicator is still pointing higher but if correction takes E$ below 1.3165 and consolidate for an hour or more, it will weaken the technical picture for the bulls. A potential scenario for today: E$ correct lower to 1.3150/60 before higher again for its last peek at 1.3205/20 before it starts it hunt for sell stops down to 1.3060/70. Adjust your stop and take profit levels accordingly. Lastly, don't forget your trailing stop.
E$ Daily chart - 1.3220/30 should provide strong resistance for this round

Tuesday 16 April 2013

Short squeeze keeps E$ stable.... (Update 1)

E$ was dragged lower by the fall of the commodity currencies albeit at a relatively slower pace, resulting in firmer EURxxx. For today, E$ should remain stable as market is potentially short squeezing overnight short positions of commodities. Let's see if ECB Draghi will add some volatility as he is due to speak at 9pm (Sin/HK).

Primary trend: Bullish
Intermediate trend: Bullish
Minor trend: Consolidate within 1.3010/20 to 1.3130/40 with eventual break towards 1.2930/50

London order book: No update due to technical feed problem

Technically, intraday indicators needs to unwind its o/s condition. Intraday oscillator indicator suggest consolidation and at current level may have upside bias. Though E$ closed a bearish engulfing candlestick pattern, price action suggest that we may not be ready to break down yet. Expected range today 1.3010/30 to 1.3130/40.

Update1: Looking to split sell rally at 1.3130/40 (1/3 ratio) and 1.3170/80 (2/3 ratio) with stop above 1.3210 with profit take at 1.3050.
E$ 4-hourly chart - Consolidation before lower

Monday 15 April 2013

Initial target hit, whatz next for XAUUSD?

Reference my last update on XAU$, "Inverted hammer, 18 Feb 13", we have reached the target range of $1,400/$1,500. Clearly, the characteristic of this wave is impulsive and I believe the WMA200 support will not be able to hold this sell-off. Downside momentum is strong and there is scope for the yellow metal to fall deeper into the $1,050/$1,200 zone. There are still lots of XAU$ held in portfolios and just last week, there were still calls to buy the dips. In view of that, XAU$ should fall another 20-25% to trigger margin calls and flush out stubborn longs. Interestingly, I wonder how the AUD$ and worldwide equities would correlate to this move.....

Primary trend: Bearish
Intermediate trend: Bearish
Minor trend: Bearish
XAU$ Weekly chart - Testing WMA200 support

E$ defying gravity for now....

Last Friday, E$ consolidated mostly within Thursday's range but pushed higher to close at 1.3111 despite a weaker environment for commodity related assets like AUD$, oil, copper and more notably, XAUUSD which plummeted through the $1,500 psychological support to close around $1,485 with a follow through this morning to $1,429.08 low so far. What are the implications? Resurgence of the USD or risk-off? Whatever the reason, one must stay vigilant and alert as turning point in any asset groups can be a prelude for the rest of the financial markets.

Primary trend: Bullish
Intermediate trend: Bullish
Minor trend: Nearing tail end of recent rally. Trend technical tool suggest higher downside risk for the next 200/300 pips.

CFTC COT report revealed that non-commercial speculator accounts have reduced their net euro short position to -50,858 vs -65,701. Net short JPY dropped very marginally to -77,697 vs -78,171.

Asian order book: (No updates yet)

Technically, shorter intraday indicators are in neutral zone while the longer one is just coming off the o/b level. Shorter intraday oscillators are pointing to consolidation and longer intraday has just started to turn down which increased the risk for downside vis-a-vis the upside. At this moment, I am mentally prepared for an exhaustive spike towards MA200 (Blue) at around 1.2940/50 (typo error) 1.3140/50 before lower. Stronger resistance stands at 1.3160/80. Expected range today, 1.3000/20 to 1.3140/50. Prefer sell rally strategy.
E$ 8-Hourly chart - MA200 resisting amid first sign of bearish divergence

Friday 12 April 2013

Bulls on steroid starting to look tired...

E$ bulls continue to reinforce its intermediate trend as it broke above March's high of 1.31339 to print 1.3138 before falling back to consolidate just above the DMA50, which sits at 1.3100 today. Thursday was a tricky day as it first broke Wednesday's low and then rally to break its high at 1.3122. For the minor trend, somehow I feel the risk for the next 200 points move is more on the downside than up. Strong resistance stands at 1.3160/80.

Primary trend: Bullish
Intermediate trend: Bullish (reinforced by breaking March's high of 1.31339 yesterday)
Minor trend: Up / Down (nearing tail end of recent rally, awaiting for longer intraday momentum to turn down)

Europe order book:
Stop loss: 1.2990, 1.3060/40, 1.3142/51, 1.3170 and 1.3180
Limit: 1.2980, 1.3080/70, 1.3142/51 and 1.3195/200

Technically, intraday indicators are approaching o/b level but definitely not close to extreme levels. Shorter intraday oscillator indicator are mixed but the longer intraday ones are still pointing higher (a good reminder for one who may get overly bearish). I normally prefer to await the longer intraday and hopefully daily momentum to turn down before committing a bigger notional. For today, expected range 1.3000/20 to 1.3120/30 (would love to fade into rally if near 1.3160/80).

E$ 4-Hourly chart - Bearish divergence further developing

Thursday 11 April 2013

Bulls running out of steam...

E$ extended it rally to touch a high of 1.3122 before giving up most of its gains to close at 1.3070, lower than its open price at 1.3082. This price action has reinforced the possibility of a completion of the 5th wave and increased the probability of a correction lower from here as guided in "Bearish divergence but bulls are still stubborn", 9 Apr Tue. At this moment, 1.2930/40 (50% fibo ratio) coincides with the DMA21 and should provide strong support. But E$ bulls must be patient and watch the momentum before attempting to buy the dip. For now, I placed a small probability for a deeper correction back to 1.28ish.

Primary trend: Bullish
Intermediate trend: Bullish
Minor trend: Bearish (correction of recent rally)

Asian order book:
Stop loss: 1.3005/990, 1.3050/40, 1.3130 and 1.3160
Limit: 1.2980 and 1.3150

Technically, shorter intraday indicator is in the o/s zone and counter-directional consolidation is needed to unwind this condition though longer intraday is still close to o/b level. Shorter intraday oscillator is pointing to a consolidation which at current level, would suggest more upside bias. Longer intraday oscillator is still pointing higher. Expected range 1.3100/10 to 1.2970/80. Looking to sell into rally with a tight stop above yesterday's high. Another level to look to sell into is at 1.3140/60 with tight stop above 1.3180.

E$ 2-Hourly chart - 50% fibonacci ratio level at 1.2930/40 provides strong support
Parallel in my iMac gave me problem yesterday as my trading system runs only on Windows platform. Bought a Windows based Samsung all-in-one desktop just for my trading now with iMac as backup.


Tuesday 9 April 2013

Bearish divergence but bulls still stubborn....

Spillover momentum from last week took E$ to a high of 1.3068 before easing off to low of 1.3005 and  consolidating around current levels. However, today's spike higher was not supported by strong enough momentum resulting in a first sign of technical weakness - bearish divergence. It may still be premature to determine that E$ has seen its near term top and will need more signals to confirm. Meantime, I maintain initial target of 1.3130/40 before a deeper correction, potentially back below 1.2900. Fundamentally, Wednesday's FOMC minutes could be a trigger to stop E$'s recent rally in its path. This can be followed up by market switching attention to any new negative development out of the eurozone toward the later part of the week.

Primary trend: Bullish
Intermediate trend: Bullish
Minor trend: Up / Down (toppish nearer 1.3130/40)

European order book: (stop orders are building up on either end and starting to get interesting)
Stop loss: 1.2890, 1.2940, 1.2995/90, 1.3070/80 and 1.3130
Limit: 1.2900, 1.3070/80 and 1.3100/15

Technically, intraday indicator is near o/b condition. Shorter intraday oscillator indicators are staring to turn lower which suggest range consolidation. Longer intraday momentum is still pointing higher though. For today, I expect range between 1.2970/80 (on first test) to 1.3080/1.3100 (expanded 1.3130/40, where I will be keen to fade into with a stop above 1.3180).
E$ 4-hourly chart - Bearish divergence, first sign of weakness

Monday 8 April 2013

Intermediate trend changed but....

Weaker than expected US job data gave E$ another boost in an already technically bull-up environment, rallying to a high of 1.30394 before easing to close the week at 1.2993. As guided in "Initial sign of market reversal, 5 Apr", a close above 1.2940/50 is definitely a welcome sign for the bulls as it has formed a bullish engulfing candlestick pattern, a relatively reliable reversal signal. Price action was impulsive and this goes inline with the bullish primary trend. Intermediate trend is confirmed to have flipped from bearish to bullish as a result of E$ breaking above the bearish channel and closing above the DMA21 and 200. Daily and weekly momentum have turned up suggesting scope for 1.3400/3500 level to be retested. Having said that, I must warn that minor trend can still be a counter-directional sharp correction (can be as deep as back to 1.2750/60) before higher again. Probability of occurrence may not be high but it cannot be discounted totally. The key fundamental drivers this week will be Wednesday's FOMC meeting minutes (Thu, 11Apr 2am Sin/HK) and Eurogroup meeting from Friday.
Spillover upside momentum should push E$ higher in the earlier part of the week before we spend the rest of the week testing the downside with a small probability of a recovery on Friday.

Primary trend: Bullish
Intermediate trend: Bullish
Minor trend: Down / Up

CFTC COT report revealed that non-commercial speculative accounts added to their net euro short position at -65,701 vs -49,095. This was the largest net euro short position since 27 November 2012. For the Yen, speculative accounts on the contrary trimmed their net short position to -78,171 vs -89,149. Above behaviour seem to suggest that market will be vulnerable to short squeezes in the euro and a continuation in the already sharp rally in USDJPY toward Y100.

Asian order book:
Stop loss: 1.2890 and 1.2970
Limit: 1.3050 and 1.3100/15

Technically, intraday indicator is approaching o/b level with still scope for more upside. Shorter intraday oscillator is suggesting consolidation but the longer intraday is still pointing firmly higher. Expected range 1.2920/40 to 1.3090/3110 (expanded 1.3130/40) on first test. Can't get overly bullish when above 1.3100 for this round.
E$ Daily chart - Broken out and up for the next few weeks

Friday 5 April 2013

Initial sign of market reversal....

E$'s initial rally was on the back of ECB leaving rate unchanged, followed by a much higher than expected number of weekly jobless claims out of the US. But Draghi's dovish comment gave market the perfect excuse to push E$ to 1.2745, flushing a series of sell stops. E$ then consolidated off the low for awhile before the short squeeze came in 2 waves with no fundamental news to support. The final wave shot to a high of 1.2948, clearing another series of buy stop orders. This kind of price action normally happens during the full moon zone though.
After last night's remarkable rebound, many are quick to change their E$ view from bearish to bullish though I feel can still be premature.

Primary trend: Bullish
Intermediate trend: In the process of flipping from bearish to bullish. Stayed above bearish channel and DMA200. Technically more bullish if weekly close above 1.2890 or even better above 1.2940/50.
Minor trend: Consolidation lower before higher

Europe order book:
Stop loss: 1.2850/40, 1.2890 and 1.2975/85
Limit: 1.2950 and 1.3050

Technically, intraday indicators are still unwinding from overnight's o/b condition. Intraday oscillator indicators at this point of writing is pointing higher but if price continues to consolidate lower, it may turn to consolidation which if E$ is at current level, it would mean more downside bias. However, daily momentum has turned higher. Expected range 1.2840/50 to 1.3000/30 on first test. For today, I have to admit that I don't have a good feel of the market rhythm.


E$ Daily chart - Pierced through bearish channel and above DMA200

Thursday 4 April 2013

Stop loss orders seeking....

Not too sure if Fed's Williams spooked the market or there were other reasons. But his comment on Fed imminent cut back on its massive bond-buying program this summer if the economy continues to pick up steam, would be something that one should sit up and start paying attention to. Xauusd dropped sharply, US equity market closed weaker and firmer USD throughout Asia. It does look like the recent correction in the greenback is probably over and its resuming its bullish run. Look at AUDUSD, despite the good set of economic data, this commodity currency was being sold off. Let's not go against the grain now and should position ourselves for firmer USD. That being said, I expect initial pressure on E$ to flush out the string of sell stops below before it rebound.

Primary trend: Bullish
Intermediate trend: Bearish for 1.2650/80 (still within bearish channel and below DMA200)
Minor trend: Mixed (down / up market)

Europe order book: (Interesting)
Stop loss: 1.2705/690, 1.2735/30, 1.2755/50, 1.2785/75, 1.2800/790, 1.2885, 1.2900/10 and 1.2920/30
Limit: 1.2705/690, 1.2755/50 and 1.2800/790

Technically, E$'s inability to break new ground yesterday topping off only at 1.2864 would put pressure on this pair to restest recent low 1.2750. Intraday oscillators have turned lower again. For today, expected range 1.2730/40 to 1.2850/60. But refrain from getting too bearish when nearer 1.2700.

E$ Daily chart - Seeking to retest recent low of 1.2750


Wednesday 3 April 2013

Eyes on ECB....

E$ retested the DMA200 and topped off at 1.2877 before retreating to current level just below 1.2800. A bounce was expected on the later half of yesterday's session but it did not materialize but instead it closed a dark cloud cover candlestick pattern and that should put pressure on E$ for at least the first half of the trading session. Gathering all available technical signals, the bears should have an edge unless 1.2877 is taken out and that would open up 1.2930/50. But for now, expect market to trade within 1.2760/70 to 1.2870/80 with consolidative price action.

Primary trend: Bullish
Intermediate trend: Bearish for 1.2650/80 (still within bearish channel and below DMA200)
Minor trend: Mixed with slight upside bias

Europe order book:
Stop loss: 1.2730, 1.2755/50, 1.2885, 1.2900/10 and 1.2930/50
Limit: 1.2700, 1.2755/50 and 1.2780/70

Technically, intraday indicators have slipped into o/s zone though not at extremes. Intraday oscillators are suggesting range bound which at current level would mean more upside bias. Daily momentum continues to point lower. Quite the typical price action ahead of ECB tomorrow and Friday's US employment numbers. For today, trade the range with tight stops knowing the intermediate trend remains bearish.

E$ Daily chart - Still below DMA200

Tuesday 2 April 2013

E$ finding support as USD fades...

Optimum liquidity should return to the market as most centres are back from the Easter holiday. E$ spent most of Monday session short-covering and then pushed higher on the back of weaker-than -expected US March ISM data, clearing a batch of buy stop at 1.2845/50 and printing high of 1.2867 before easing to consolidate around current level. More stop loss orders above continue to attract attention and momentum seems to be able to support another run for 1.2950/60. Market's first focus is on RBA rate announcement later at 11:30am (Sin/HK).

By the way, there seem to be sign of USD running out of steam in recent days.

Primary trend: Bullish
Intermediate trend: Bearish for 1.2650/80 (degree of bearishness has fallen as momentum seems to be turning higher. However, still within bearish channel and below DMA200)
Minor trend: Mixed with upside bias

NY order book:
Stop loss: 1.2730, 1.2755/50, 1.2890/910, 1.2920 and 1.2930/50
Limit: 1.2700, 1.2755/50 and 1.2875

Technically, intraday indicators are getting into o/b zone though not extreme. Shorter intraday oscillators are still suggesting consolidation but with slight upside bias. Longer intraday oscillator though still pointing lower but waning. In summary, technical signals favour another day of higher price action with initial resistance 1.2875/85 for a correction lower to 1.2800/20 (on first test) before another push for 1.2940/60. However, I do not foresee E$ being able to sustain above 1.2900 for this round. I prefer to buy the dip before 1.2900 is seen first.

E$ Daily chart - Retest DMA21 at 1.2930/40

Monday 1 April 2013

Range trade....

Amid a lacklustre and illiquid environment, market remains focus on the heightened worries about debts and fiscal problems in the eurozone. A weak weekly close at 1.28168 should put recent low of 1.2751 as target for retest this week with lots of economic data releases to provide the impetus. Other than the tension in the Korean peninsula, we have ECB rate announcement on Thursday and US employment numbers on Friday. As mentioned earlier, E$ remains technically weak considering where it closed for the week and for the month. We should see initial sell pressure but that being said, E$ may start to find a base from the recent sell-off in April.

Primary trend: Bullish
Intermediate trend: Bearish for 1.2650/80 (still within bearish channel, below DMA200)
Minor trend: Bearish

CFTC COT non-commercial speculator accounts revealed that euro net short position has increased to -49,095 vs -24,787. Net short jpy was reduced marginally to -89,149 vs -93,763.

Asia order book:
Stop loss: 1.2700, 1.2750, 1.2850 and 1.2900/10
Limit: Barrier at 1.2700

Technically, intraday indicators are slipping into o/s zone though still far from extreme. Shorter intraday oscillator indicators are still suggesting range consolidation between 1.2750/60 to 1.2840/50 for now, though the longer intraday momentum is still pointing lower. With today's environment, barring any major random news, trade above range with tight stops.

E$ 8-hourly chart - Too many centres off for Easter, lacklustre drift