Apologies. Having problems with my fibre optic network and hopefully can be resolved by this weekend.
All the best.
Friday, 28 December 2012
Thursday, 27 December 2012
Cliffhanger...
Hi folks!!
Market will remain listless till it gets direction from the US fiscal cliff talk probably starting today as President Obama cut short his holiday in Hawaii to rush back on Wednesday, indicated the urgency.
As expected, E$ stayed within the range during the past 2 days as forecast in my last blog "Bears to pull the sleigh for now" and I am not expecting it to deviate from 1.3150/60 to 1.3250/60 for now until new fundamental input.
Trend remains up for E$, supported by EURJPY, but at current price level at this moment, after the recent rally, makes it susceptible to negative news. A short term correction if it materializes, can go as deep as 1.2940/50.
For today, short term intraday indicator is close to o/b level and that supports the range trade view. However, with price holding near the higher band of range over the past 24hrs, intraday momentum has gradually shifted from consolidation to slight upside bias.
For today, I do not encourage position taking as market has switched to more of a fundamentally driven market. Liquidity is sub-optimal and that makes it even more unreliable for technical analysis. Probability has dropped to 50/50, however, it is still better than casino probability because house always has average edge of 1+% over player.
USDJPY
Now that my target of Y85 has been reached (read blogs dated 23/26 Nov 12), let's update the forecast for the next phase.
From the monthly chart, one can "feel" the possibility of a reversal in major trend for the $JPY. After spending 3 years (from 2009 to 2011) of probing lower amid fading momentum, the market finally rebound after hitting a low of Y75.30 on the 31 Oct 2011, before BOJ's massive intervention. These past 2 months's price action supported by firm momentum has clearly turned things around quite a bit. Though daily and weekly indicators are in extreme o/b levels, one has to be aware that in a major trend reversal, indicators can get "stucked" as price continues to punch higher. Based on time and price, $JPY remains susceptible to negative news at current levels. Y83.80/84.00 provides good support for now with next target at Y89/90 in the coming months.
Market will remain listless till it gets direction from the US fiscal cliff talk probably starting today as President Obama cut short his holiday in Hawaii to rush back on Wednesday, indicated the urgency.
As expected, E$ stayed within the range during the past 2 days as forecast in my last blog "Bears to pull the sleigh for now" and I am not expecting it to deviate from 1.3150/60 to 1.3250/60 for now until new fundamental input.
Trend remains up for E$, supported by EURJPY, but at current price level at this moment, after the recent rally, makes it susceptible to negative news. A short term correction if it materializes, can go as deep as 1.2940/50.
For today, short term intraday indicator is close to o/b level and that supports the range trade view. However, with price holding near the higher band of range over the past 24hrs, intraday momentum has gradually shifted from consolidation to slight upside bias.
For today, I do not encourage position taking as market has switched to more of a fundamentally driven market. Liquidity is sub-optimal and that makes it even more unreliable for technical analysis. Probability has dropped to 50/50, however, it is still better than casino probability because house always has average edge of 1+% over player.
 |
| E$ Daily chart |
Now that my target of Y85 has been reached (read blogs dated 23/26 Nov 12), let's update the forecast for the next phase.
From the monthly chart, one can "feel" the possibility of a reversal in major trend for the $JPY. After spending 3 years (from 2009 to 2011) of probing lower amid fading momentum, the market finally rebound after hitting a low of Y75.30 on the 31 Oct 2011, before BOJ's massive intervention. These past 2 months's price action supported by firm momentum has clearly turned things around quite a bit. Though daily and weekly indicators are in extreme o/b levels, one has to be aware that in a major trend reversal, indicators can get "stucked" as price continues to punch higher. Based on time and price, $JPY remains susceptible to negative news at current levels. Y83.80/84.00 provides good support for now with next target at Y89/90 in the coming months.
 |
| $JPY Month chart - |
Monday, 24 December 2012
Christmas Special..... Bears to pull the sleigh for now
Gooood Monday morning folks, its Christmas Eve!!!! Let's face it, all you diehard traders.... you should take a break today considering the fact that Japan and Germany are out (US half day) and tomorrow is Christmas Day with most of the world out. So one can imagine the liquidity condition. Even my regular 0.4pip spread in E$ is flipping to 0.6/0.8pip now and then.
For my American friends, its Cliffmas week. But let us all worry about that from Thursday onwards. Undoubtedly, it will be the main fundamental driver for the market to close the year.
For today, o/s intraday indicator should provide some form of a support for now with intraday momentum turning from down to consolidation/up. This blends in well with the current environment where there is basically no economic data releases worldwide. Attention seeking politicians or central bankers will probably keep their mouth shut as no one will appreciate their view ahead of Christmas. Expected range between 1.3150/60 to 1.3250/60.
Chart 1
Last week, E$ closed a Shooting Star candlestick pattern and this should put pressure on the 1.3144 support level (do note that the Shooting Star pattern is not always a bearish signal and it must not be read in isolation). Amid an illiquid environment, one must be mentally prepared that E$ may fall sharply to the 1.3030/40 zone (yellow line) or even retest 1.2940/50 (level for this week), the falling trend line it broke above 3 weeks ago, on any negative outcome from the fiscal cliff talk. That being said, one would have noticed I used the word "retest". The fact is, E$ has already broken higher supported by firmer momentum. Therefore, any quick sell-off should be viewed as opportunity to buy cheaper E$ rather than to switch to a trend change mentality. By the way, let me explain the significance of the yellow line. Looking at where the line cuts through 2012, one would have noticed that this band has been kind of a pivot and E$ has successfully re-captured and closed 2 consecutive weeks above.
 |
| Chart1: E$ Weekly |
As a day trader, it is still important to be aware of the longer term trend. In the monthly chart, one would have quickly noticed E$ bouncing off the MA200 twice. This year, the low established was 1.2042 before rebounding closer to the 2012 high so far at 1.3486. If E$ was to fall back to around 1.2940/50, as mentioned above, to close for the year, we would have formed a Doji pattern as we started 2012 at 1.2931. A Doji candlestick pattern at the lower range could be a bullish signal for E$ in 2013. Another bullish supporting signal is the fact that price has re-captured the rising trend line (circled). Main obstacle right now are the bunch of moving averages around 1.34/3500 band. Clearing that hurdle will open up 1.4ish in the new year.
 |
| Chart 2: E$ Monthly - MA21 (Red), MA50 (Green), MA100 (Brown), MA200 (Blue) |
Friday, 21 December 2012
Tweezer top
Sorry folks, crashed out after taking my medication this morning and had to forego my afternoon 18-holes :( Still suffering from jetlag and fever since I returned, but managed to wake up alive past the Mayan 21/12/12 deadline :)
Last night, market short squeezed E$ to the high of 1.3295 but failed to break previous high of 1.3308 (hmmm, smells fishy again with the 8!). The subsequent steep sell-off formed the tweezer formation which in simplistic term is called the "double-top". As mentioned yesterday, market may not be too keen to take this pair higher into the resistance zone without a sign of optimism out of the US for now. Do take note that liquidity is sub-optimal at this time of the year and spikes/gapping can be quite common.
Order is getting quite busy...
Limit: 1.3115/25, 1.3255/65 and 1.3300/10
Stop loss: 1.3140/50, 1.3170, 1.3320 and 1.3350
Heard the Asian sovereign bid interest at 1.3140/50 has been pulled out.
Technically, almost identical pattern as yesterday with the shorter term intraday momentum indicating consolidation with an upside bias but the longer term intraday momentum suggesting more room on the downside. With the tweezer formation, pressure will continue to be on the E$ to test lower.
For today and possibly over to next Monday, I expect an up>down market with E$ testing 1.3260/80 on the upside before falling back to 1.3120/30.
All the best and have a great weekend!! I feel warmed up already and will share an update on USDJPY next week following my 23/26 November blogs ("8=Prosperity" and "E$ Bulls edged the Bears" respectively).
 |
| E$ 8 Hourly chart - Tweezer top formation |
Thursday, 20 December 2012
Shooting star!
Good morning folks! Hope everyone had a great time trading in the past 3 weeks.
Just to share my observation from my holiday in the West Coast of USA. I am sure tourists are pouring to the country as the U$ is relatively weaker and this gives them more spending power. Just my friends alone, I know of about 6 families who have chosen West Coast as their year end vacation choice! Car rental and food are way cheaper than Europe. Gasoline price is surprisingly high though still cheaper than Europe and Singapore. One thing for sure, the service level has gone noticeably higher and I find Americans very helpful and generally friendly. I noted improvement in infrastructure like the roads. By the way, the Las Vegas strip is phenomenal! Lastly, I notice advertisements of easier credit to consumers (the QE is working!!).
Back to the market.... E$ was enjoying a great run, touching the high 1.3308 last night until news of stalled fiscal cliff talk between President Obama and the Republicans hit the market, sending E$ to close all the way near to the day's low near to where it opened. This reaction formed a shooting start formation in the candlestick pattern and is a short term bearish signal, which the spillover momentum depress E$ to 1.3189 low this morning. Yesterday's reaction to negative news is not totally unexpected considering how much it had run up recently and coming close to major resistance levels (around the 1.3400 level) would trigger some profit taking interest.
Latest update on the order book revealed the following:
Limit: 1.3140/50 and 1.3350
Stop Loss: 1.3140, 1.3310 and 1.3350
Technically, short term intraday indicator has bounced off o/s levels though longer term still has more room on the downside. Shorter intraday momentum suggest consolidation with upside bias but longer term momentum suggest consolidation to down.In summary, I expect some uptick from here but E$ may subsequently turn lower again. Expected range 1.3130/40 to 1.3250/60.
All the best.
 |
| E$ Daily chart - Shooting star formation |
Monday, 26 November 2012
E$ Bulls edged the Bears
Good afternoon folks! This will be my last update before I head for my year end holiday and the next update will be from the 20th Dec 12.
E$ exceeded my expectation last Friday by printing a high of 1.2991 even though I have made provision for that move. As I have mentioned in "8 = Prosperity", dated 23 Nov 12, a convincing close above 1.2900 now would be a bullish signal for this currency pair despite the fact that it is still staying below the trend line (see chart). On the daily chart, it is already staying above the 21, 50, 100 and 200DMAs. On the weekly chart, it is staying above the 21 and 50WMAs but still below the 100 and 200WMA at 1.3405 and 1.3510 respectively. Daily momentum remains strong but we are nearing o/b condition and this has increased the probability of a near term consolidation. On the upside, the easy money phase is probably over for now. The next phase of this climb will be faced with more intraday volatility. Today, we have EU leaders meeting once again and any lack of commitment should send the E$, which at current levels is more vulnerable, lower.
Order book this morning revealed the following:
Stop loss: 1.2730/40
Limit: 1.2850/70 and 1.3000
Technically, intraday indicator is in o/b levels and any rally here may not be sustainable. Intraday momentum is starting to show signs of turning from up to consolidation. I would expect price to soften back to retest 1.2900 but am wary of a possibility of deeper correction to 1.2840/60. Having said that, I would still prefer to buy on the dip.
For today, 1.2900 (1.2840/60 news induced) to 1.2980/90 (1.3030/40 expanded)
In the weeks ahead, as long as 1.2900 pivot holds, we are probably in for a progressive appreciation of E$ to challenge previous high of 1.3172 with the next target at 1.3400.
USDJPY
The easy money rally phase is over and the next phase will take us off road with more intraday volatility but still headed for the objective of Y85. For this week, the expected range is from Y81.70/80 to Y83.40/60.
All the best. Whatever you do, always remember to put in your stop loss order and protect your profit. I will catch up with all when I return.
E$ exceeded my expectation last Friday by printing a high of 1.2991 even though I have made provision for that move. As I have mentioned in "8 = Prosperity", dated 23 Nov 12, a convincing close above 1.2900 now would be a bullish signal for this currency pair despite the fact that it is still staying below the trend line (see chart). On the daily chart, it is already staying above the 21, 50, 100 and 200DMAs. On the weekly chart, it is staying above the 21 and 50WMAs but still below the 100 and 200WMA at 1.3405 and 1.3510 respectively. Daily momentum remains strong but we are nearing o/b condition and this has increased the probability of a near term consolidation. On the upside, the easy money phase is probably over for now. The next phase of this climb will be faced with more intraday volatility. Today, we have EU leaders meeting once again and any lack of commitment should send the E$, which at current levels is more vulnerable, lower.
Order book this morning revealed the following:
Stop loss: 1.2730/40
Limit: 1.2850/70 and 1.3000
Technically, intraday indicator is in o/b levels and any rally here may not be sustainable. Intraday momentum is starting to show signs of turning from up to consolidation. I would expect price to soften back to retest 1.2900 but am wary of a possibility of deeper correction to 1.2840/60. Having said that, I would still prefer to buy on the dip.
For today, 1.2900 (1.2840/60 news induced) to 1.2980/90 (1.3030/40 expanded)
In the weeks ahead, as long as 1.2900 pivot holds, we are probably in for a progressive appreciation of E$ to challenge previous high of 1.3172 with the next target at 1.3400.
 |
| E$ Weekly chart - Close to trend line with strong momentum |
The easy money rally phase is over and the next phase will take us off road with more intraday volatility but still headed for the objective of Y85. For this week, the expected range is from Y81.70/80 to Y83.40/60.
 |
| USDJPY Monthly chart - Staying afloat |
Friday, 23 November 2012
8 = Prosperity
TGIF folks!! 2 more trading days before I head off for my year end holiday :)
Yesterday's session was dominated by Asian players. Heard the demand in the afternoon session came partly from BOK (Bank of Korea) which recently intervened to buy USDKRW and now wanted to switch the USD holding (worth approximately USD1.5billion) to EUR. As expected, E$ was then pushed to print a high of 1.28988 before meeting with Asian sovereign supply ahead of an option barrier at 1.2900. I will not dispute the authenticity of that rumor when the footprint that was left behind clearly indicated the Chinese presence. In case you are unaware, the number "8" is auspicious because it sounds like prosperity in Chinese and we love that number. The rich and famous are even willing to pay hundreds of thousands just to bid for one to be placed on their car plate. Heard that they have recycled it at around the 1.286ish level.
Order book is really thin now based on last night:
Stop loss: 1.2730/40 and > 1.2900
Limit: 1.2900
Technically, intraday indicator is at o/b level but not extreme. Intraday momentum has shown signs of bearish divergence which has increased the probability of a near term top around 1.2900. However, the daily upside momentum remains firm and pointing higher. This bullish view is supported by the break up from the trend line (see chart). Currently we are trapped between 2 pivot levels i.e. 1.2820 and 1.2900 and a close below or above them should confirm a continuation in that direction in the near term. Having considered all available technical signals, E$ bulls have the edge for now.
For today, one can still try to trade the 1.2800/20 to 1.2900/10 range again (1.2950/80 expanded) and I prefer to buy the dip with risk below 1.2870.
USDJPY
Sign of bearish divergence followed by a rejection around 82.84 high to close lower yesterday was merely a mild consolidation of its recent parabolic move. Support level has moved higher today to 82.00 and I still maintain a bullish picture for USDJPY in the coming weeks. Initial targets Y84/85.
All the best!
Yesterday's session was dominated by Asian players. Heard the demand in the afternoon session came partly from BOK (Bank of Korea) which recently intervened to buy USDKRW and now wanted to switch the USD holding (worth approximately USD1.5billion) to EUR. As expected, E$ was then pushed to print a high of 1.28988 before meeting with Asian sovereign supply ahead of an option barrier at 1.2900. I will not dispute the authenticity of that rumor when the footprint that was left behind clearly indicated the Chinese presence. In case you are unaware, the number "8" is auspicious because it sounds like prosperity in Chinese and we love that number. The rich and famous are even willing to pay hundreds of thousands just to bid for one to be placed on their car plate. Heard that they have recycled it at around the 1.286ish level.
Order book is really thin now based on last night:
Stop loss: 1.2730/40 and > 1.2900
Limit: 1.2900
Technically, intraday indicator is at o/b level but not extreme. Intraday momentum has shown signs of bearish divergence which has increased the probability of a near term top around 1.2900. However, the daily upside momentum remains firm and pointing higher. This bullish view is supported by the break up from the trend line (see chart). Currently we are trapped between 2 pivot levels i.e. 1.2820 and 1.2900 and a close below or above them should confirm a continuation in that direction in the near term. Having considered all available technical signals, E$ bulls have the edge for now.
For today, one can still try to trade the 1.2800/20 to 1.2900/10 range again (1.2950/80 expanded) and I prefer to buy the dip with risk below 1.2870.
 |
| E$ Daily chart - Bulls have upper hand |
Sign of bearish divergence followed by a rejection around 82.84 high to close lower yesterday was merely a mild consolidation of its recent parabolic move. Support level has moved higher today to 82.00 and I still maintain a bullish picture for USDJPY in the coming weeks. Initial targets Y84/85.
 |
| USDJPY Monthly chart - Break out and up |
Thursday, 22 November 2012
EUR up, JPY also up!
Happy Thanksgiving to all my friends round the world. Peace, No War please... civilians (kids and women) are dying!!
Clearly, yesterday's E$ range was pretty much a 3 in 1, an accelerated move which combined today and part of tomorrow into last night's price action. Normally the case when US is going into a super long weekend. Just by looking at the chart below, without too many other technical analysis, one would quickly conclude that E$'s ability to stay above another 3 & 1, the 3 DMAs (red-21, blue-200, brown-100) and just below 1 DMA (green-50), is a near term bullish signal. With market caught short as evident in the CFTC data ("Shortened week & poor liquidity", 19 Nov), a move back and close above 1.2900 (a crucial pivot level) would turn the technical quite bullish and could put the recent high of 1.3169 back on the radar again. EU leaders will meet on Monday (again) to discuss on the aids for Greece but the chances of a partial solution will get higher and this could be factored in by this week.
Order book updated this morning:
Stop loss: 1.2700, 1.2730, 1.2870 and 1.2910
Limit: 1.2880-900
Technically, intraday indicator is close to o/b level but not extreme and should still have room on the upside in a trending market. Intraday momentum remains firmly pointing up. 2 days of the long shadow doji (close) formation supports the bullish pictures. With a sharp reversal just yesterday, we may not see a deep correction before the next stage of the rally continues.
For today, before 1.2880/900 is tested, I am looking to buy dips. Expected range 1.2800/20 to 1.2880/900 (1.2950 expanded).
Do take note that market liquidity will be sub-optimal and expect a bit of whipsaw.
USDJPY
Upside momentum is fading on the JPYxxx and USDJPY should be capped below Y83.00 for now and a consolidation towards 81.80 is highly likely today.
Clearly, yesterday's E$ range was pretty much a 3 in 1, an accelerated move which combined today and part of tomorrow into last night's price action. Normally the case when US is going into a super long weekend. Just by looking at the chart below, without too many other technical analysis, one would quickly conclude that E$'s ability to stay above another 3 & 1, the 3 DMAs (red-21, blue-200, brown-100) and just below 1 DMA (green-50), is a near term bullish signal. With market caught short as evident in the CFTC data ("Shortened week & poor liquidity", 19 Nov), a move back and close above 1.2900 (a crucial pivot level) would turn the technical quite bullish and could put the recent high of 1.3169 back on the radar again. EU leaders will meet on Monday (again) to discuss on the aids for Greece but the chances of a partial solution will get higher and this could be factored in by this week.
Order book updated this morning:
Stop loss: 1.2700, 1.2730, 1.2870 and 1.2910
Limit: 1.2880-900
Technically, intraday indicator is close to o/b level but not extreme and should still have room on the upside in a trending market. Intraday momentum remains firmly pointing up. 2 days of the long shadow doji (close) formation supports the bullish pictures. With a sharp reversal just yesterday, we may not see a deep correction before the next stage of the rally continues.
For today, before 1.2880/900 is tested, I am looking to buy dips. Expected range 1.2800/20 to 1.2880/900 (1.2950 expanded).
Do take note that market liquidity will be sub-optimal and expect a bit of whipsaw.
 |
| E$ Daily chart - Staying above 3 and just below 1... bullish signal? |
USDJPY
Upside momentum is fading on the JPYxxx and USDJPY should be capped below Y83.00 for now and a consolidation towards 81.80 is highly likely today.
Wednesday, 21 November 2012
Near term reversal?
Good afternoon folks!!
Myth busted that golf is not a physically demanding game. Wait till you play 18-holes in an undulating course with a push cart (in Singapore) under 35 degrees Celsius (definitely felt like it) temperature with almost 90% humidity!! Looks like I need to jog 5km regularly to bring my fitness level to par.
On the market.... E$ almost closed with a doji formation (see chart) yesterday and today, it looks like an evening doji star formation at this moment. From yesterday's close, market was already all set for the negative news and it came when Germany's Schaeble announced that no agreement has been made and that the ministers are due to meet again Monday (are we so not surprised??). Failure to penetrate the 21DMA (see chart) and a subsequent rejection at that level is the first bearish signal for the E$. However, we are probably at the crossroad now with price stucked between 1.2750 and 1.2775 with a break either way would see a continuation in that direction for the next 4 hours.
Order book as of this morning:
Stop loss: 1.2700/05, 1.2720, 1.2828/30, 1.2900 and 1.2910
Limit: 1.2700/05, 1.2720 and 1.2900
Technically, shorter term intraday indicator is at o/s level though not extreme. Intraday momentum has turned from down to consolidation to up after it held 1.2737 for up to 4 hours but it is not conclusive. Taking all available technical tools into consideration, the bears have an upper hand now unless it recaptures 1.2775 to relieve the short term sell pressure. A close below 1.2740 today will put more pressure on E$ to retest recent low of 1.2661.
Expected range today: 1.2690/700 to 1.2820/30
Will update when I see opportunity in other currency pairs. All the best!
 |
| E$ Daily chart - Rejected at 21(red) DMA |
Tuesday, 20 November 2012
Awaiting good news...
Good afternoon, folks!
Does jogging 5km everyday protects someone in their 40s from stroke totally? The answer is NO, bottom line, watch your diet..... you are what you eat. Someone close recently had a mild stroke and today had a stent implanted in the artery at the neck to prevent future recurrence. Tomorrow, I will be playing my 18 holes and have recently switched from the luxury of moving around in the golf buggy to using a push cart instead (not even battery powered). Starting to enjoy walking as I can study the green better as I approach from the fairway.
When all eyes are on the EU Finmin meeting today, Moody's stole the limelight by downgrading France by 1 notch in the early morning sending E$ back below 1.2800 to 1.2765 low. However, bid appeared and supported the currency pair. Sub-optimal market liquidity is already evident and can only get worse each passing day.
Order book is quite empty now:
Stop loss: 1.2750, 1.2830/40 and 1.2880
Technically, intraday indicator is at pretty neutral level. Intraday momentum is getting a bit mixed too due to this morning's sell-off and it has fractured and weakened the nearer term picture with a risk of testing lower to 1.2730/40 if we continue to hover around current level for too long. However, longer term intraday momentum is still pointing firmly higher for now.
For today, expect trading range 1.2730/40 to 1.2830/40.
USDJPY
Just to put in a monthly chart for all to see the break out and up from recent consolidation.
Does jogging 5km everyday protects someone in their 40s from stroke totally? The answer is NO, bottom line, watch your diet..... you are what you eat. Someone close recently had a mild stroke and today had a stent implanted in the artery at the neck to prevent future recurrence. Tomorrow, I will be playing my 18 holes and have recently switched from the luxury of moving around in the golf buggy to using a push cart instead (not even battery powered). Starting to enjoy walking as I can study the green better as I approach from the fairway.
When all eyes are on the EU Finmin meeting today, Moody's stole the limelight by downgrading France by 1 notch in the early morning sending E$ back below 1.2800 to 1.2765 low. However, bid appeared and supported the currency pair. Sub-optimal market liquidity is already evident and can only get worse each passing day.
Order book is quite empty now:
Stop loss: 1.2750, 1.2830/40 and 1.2880
Technically, intraday indicator is at pretty neutral level. Intraday momentum is getting a bit mixed too due to this morning's sell-off and it has fractured and weakened the nearer term picture with a risk of testing lower to 1.2730/40 if we continue to hover around current level for too long. However, longer term intraday momentum is still pointing firmly higher for now.
For today, expect trading range 1.2730/40 to 1.2830/40.
 |
| E$ Daily chart - Fighting with MAs |
Just to put in a monthly chart for all to see the break out and up from recent consolidation.
 |
| USDJPY Monthly chart - Bouncing off 21MMA (red) to 50MMA (green)? |
Monday, 19 November 2012
Shortened week & poor liquidity....
Gooood Monday morning folks!!
Had a reasonably great week but had to give a little back on Friday as the E$ decide to correct lower first before higher again. Right after testing the 100DMA at 1.2800 on Thursday, E$ does not have enough momentum to push further as uncertainties continue to lurk ahead of the Nov 20 EU Finance Minister meeting. This gave market the opportunity to long liquidate and flush large sell stops at 1.2700. I was already a little apprehensive when it broke the shorter term up-trend line (see chart) but decided to hang in there with a tight stop nonetheless.
This week is kind of a shortened one for the Americans as they celebrate Thanksgiving on 22 Nov (Thu). Most traders would have planned to head home earlier and take the Friday off. So market liquidity will suffer and one should be mentally prepared for potential whipsaws, especially when E$ is still trading within the daily cloud.
Just to clarify my stand on the fiscal cliff's impact on the market.... I see market selling risk ahead of the deadline and this would translate to USD strength for now. However, at the back of our mind, we know the political leaders will come to a compromise and have a bipartisan resolution at the eleventh hour. Uniquely, this time round, selling risk may not affect all JPY crosses as we become more diverse.
CFTC speculative accounts revealed that net euro shorts have increased to -83,646 vs -67,141 and net short JPY surprisingly reduced to -30,447 vs -40,104. These information supports higher euro and weaker jpy.
No update on the order book just yet and this information is based on early Friday NY session:
Stop loss: 1.2650/55, 1.2680, 1.28025, 1.2810 and 1.2820
Limit: 1.2850
Technically, intraday indicator is on average around the 60% mark and there is room for more upside. Intraday and daily momentum remains firm and still pointing higher.
For today, expected range 1.2730/40 to 1.2830/40. 1.2800 remains as strong resistance. A break of 1.2690 will open up 1.2640/50.
USDJPY
Had a reasonably great week but had to give a little back on Friday as the E$ decide to correct lower first before higher again. Right after testing the 100DMA at 1.2800 on Thursday, E$ does not have enough momentum to push further as uncertainties continue to lurk ahead of the Nov 20 EU Finance Minister meeting. This gave market the opportunity to long liquidate and flush large sell stops at 1.2700. I was already a little apprehensive when it broke the shorter term up-trend line (see chart) but decided to hang in there with a tight stop nonetheless.
This week is kind of a shortened one for the Americans as they celebrate Thanksgiving on 22 Nov (Thu). Most traders would have planned to head home earlier and take the Friday off. So market liquidity will suffer and one should be mentally prepared for potential whipsaws, especially when E$ is still trading within the daily cloud.
Just to clarify my stand on the fiscal cliff's impact on the market.... I see market selling risk ahead of the deadline and this would translate to USD strength for now. However, at the back of our mind, we know the political leaders will come to a compromise and have a bipartisan resolution at the eleventh hour. Uniquely, this time round, selling risk may not affect all JPY crosses as we become more diverse.
CFTC speculative accounts revealed that net euro shorts have increased to -83,646 vs -67,141 and net short JPY surprisingly reduced to -30,447 vs -40,104. These information supports higher euro and weaker jpy.
No update on the order book just yet and this information is based on early Friday NY session:
Stop loss: 1.2650/55, 1.2680, 1.28025, 1.2810 and 1.2820
Limit: 1.2850
Technically, intraday indicator is on average around the 60% mark and there is room for more upside. Intraday and daily momentum remains firm and still pointing higher.
For today, expected range 1.2730/40 to 1.2830/40. 1.2800 remains as strong resistance. A break of 1.2690 will open up 1.2640/50.
 |
| E$ 2-hourly chart - All about trend lines |
Fundamentally, the existing political uncertainties and further BOJ QE should continue to put pressure on JPY. Technically, this pair has also broken out and up from her slumber and we are probably looking for Y83/84 to be revisited in the weeks ahead. More elaborate technical analysis when I have the time.
Follow-up
USDCAD
Taken profit on the short USDCAD already ahead of target of 0.9940/50 and have decided leave this pair alone for now though tech indicators are still favoring lower USDCAD first before higher again along with USD strength.
USDSGD
Took profit on the quick run up in USDSGD but still maintain that it has broken up from its consolidation and expect to see higher USD in the coming weeks. Have re-established long again and keeping risk below 1.2220 for now. Immediate target 1.2350/60.
Friday, 16 November 2012
USD to reign.... (Update1)
TGIF!!! I hope you had a great day, if you know what I mean! Below are 2 trade recommendations that one will not be able to reconcile with today's title :)
I have not been that active for awhile but yesterday was exceptional and I was kinda surprised when I looked at my trade blotter. I traded in EURUSD, EURGBP, EURAUD, EURJPY and USDCAD. Of course, as far as the EURxxx are concerned, it was entered at different phases and not all at a go. That is something I want to share for the purpose of learning. Never over-expose yourself on the same same currency cross just because they all gave the same buy or sell signal (they often do when broken out of range). In case you are wrong, they normally will be wrong for most. Learn to be conservatively aggressive even when trading with a high confidence level.
EURUSD
E$ finally retested the 100DMA (blue) as expected. So what's next? Not surprising, it seems like the market is starting to factor in a resolution to the U.S. fiscal cliff. It is not in the interest of whichever party to see the country fall further into the abyss as a result of politicking. There will be a bipartisan resolution at the eleventh hour! In view of that, I see a firmer USD environment going into year end. Then one will question me as to why the E$ would move higher then.... let me remind you once again that the euro is actually the next most popular left hand side currency. As the market sells the AUD, NZD, GBP and JPY against the USD, they buy the EURxxx too.
Order book is reflecting active participation too:
Stop loss: 1.2650/55, 1.2680, 1.2700/05, 1.2803, 1.2812 and 1.2820
Limit: 1.2700/05 and 1.2850
Technically, intraday indicator still has room for more upside. Price action is still on a healthy gradient with momentum still firming pointing higher. The rally in the EURAUD has the characteristic of a reversal at the early stage i.e. powerful. This supports the view that E$ should have more mileage on the upside.
For today, expect market to consolidate within 1.2750/60 to 1.2800/10 before breaking higher for 1.2850/60. Risk to below 1.2715.
USDCAD (Follow-up)
Now you are going to question why I am going short USDCAD when I see USD strength. Sometimes, I get the signals from my technical tools before I analyze the possible rationale. Admittedly, this trade is against the weekly trend but signal is strong. The unwinding in the inter-commodity currencies (i.e. AUDCAD & NZDCAD) will put pressure on this pair for now. Bearish divergence and weak momentum support this view.
For today, 1.0050/60 should cap and I expect it to fall towards 0.9940/50. Watch the price action when it tests 0.9970/80.
Update1:

All the best and have a great weekend!!
I have not been that active for awhile but yesterday was exceptional and I was kinda surprised when I looked at my trade blotter. I traded in EURUSD, EURGBP, EURAUD, EURJPY and USDCAD. Of course, as far as the EURxxx are concerned, it was entered at different phases and not all at a go. That is something I want to share for the purpose of learning. Never over-expose yourself on the same same currency cross just because they all gave the same buy or sell signal (they often do when broken out of range). In case you are wrong, they normally will be wrong for most. Learn to be conservatively aggressive even when trading with a high confidence level.
EURUSD
E$ finally retested the 100DMA (blue) as expected. So what's next? Not surprising, it seems like the market is starting to factor in a resolution to the U.S. fiscal cliff. It is not in the interest of whichever party to see the country fall further into the abyss as a result of politicking. There will be a bipartisan resolution at the eleventh hour! In view of that, I see a firmer USD environment going into year end. Then one will question me as to why the E$ would move higher then.... let me remind you once again that the euro is actually the next most popular left hand side currency. As the market sells the AUD, NZD, GBP and JPY against the USD, they buy the EURxxx too.
Order book is reflecting active participation too:
Stop loss: 1.2650/55, 1.2680, 1.2700/05, 1.2803, 1.2812 and 1.2820
Limit: 1.2700/05 and 1.2850
Technically, intraday indicator still has room for more upside. Price action is still on a healthy gradient with momentum still firming pointing higher. The rally in the EURAUD has the characteristic of a reversal at the early stage i.e. powerful. This supports the view that E$ should have more mileage on the upside.
For today, expect market to consolidate within 1.2750/60 to 1.2800/10 before breaking higher for 1.2850/60. Risk to below 1.2715.
 |
| E$ Daily chart - Fibonacci retracement levels |
Now you are going to question why I am going short USDCAD when I see USD strength. Sometimes, I get the signals from my technical tools before I analyze the possible rationale. Admittedly, this trade is against the weekly trend but signal is strong. The unwinding in the inter-commodity currencies (i.e. AUDCAD & NZDCAD) will put pressure on this pair for now. Bearish divergence and weak momentum support this view.
For today, 1.0050/60 should cap and I expect it to fall towards 0.9940/50. Watch the price action when it tests 0.9970/80.
 |
| $CAD Daily chart - Bearish divergence |
USDSGD
This currency pair often acts as a confirmation of a change in the USD trend. Why? because it does not lead, it follows as the SGD is weighted against a basket of currencies of our trading partners and it reacts according to the relative value. Fundamentally, the Ministry of Trade & Industry (MTI) cut its 2012 GDP growth forecast to the low end of the estimate at 1.5% and forecast 2013 to be within 1-3%.
Technically, USDSGD has broken out of its consolidation and down trend line (see chart) and this has increased the probability of heading towards 1.2380 and then 1.2500 in the weeks ahead.

All the best and have a great weekend!!
Thursday, 15 November 2012
Tight range but still up....
Good afternoon folks! Had a good run? Something arose this morning and have to run out to get it settled. Received a great piece of news when my boy came back from school yesterday, he topped his primary 1 class in mathematics and did very well in other subjects too!! :)
Ok, back to the market..... frankly, there wasn't any single piece of good news to justify the E$'s rally yesterday but it did. EURAUD rallied along as the A$ faltered. In my earlier post, I have mentioned that E$ may fall into the 1.26ish region as a target and we probably have seen it achieved that with the recent low of 1.2661. Just looking at the chart below, it is starting to show a possible bottom in the making after sessions of down move. The 100(brown)DMA seems to be supporting E$ and the probability of E$ rebounding to test the 200(blue)DMA at 1.2800/10 is high for now.
Order book: Updated1
Stop loss: 1.2650/55, 1.2680, 1.2700/05, 1.2800 and 1.2850
Limit: 1.2620/30, 1.2800 and 1.2850
Technically, intraday indicator is only around the 60% mark and there is enough scope for the E$ to push further. Intraday momentum remains firm and still pointing up. As we are still in the daily cloud, expect choppy price action.
For today, on a more conservative side, the trading trade is from 1.2700/10 to 1.2765/75 (first resistance) and then 1.2800/10. I still prefer to be on the long side until closer to the resistance.
All the best! Will update again if I see any other opportunities on other currency pairs.
Update2:
USDCAD (1.0013)
This currency pair looks heavy and should drift to first support 0.9960/70 and then 0.9940/50. Risk above 1.0040.
Ok, back to the market..... frankly, there wasn't any single piece of good news to justify the E$'s rally yesterday but it did. EURAUD rallied along as the A$ faltered. In my earlier post, I have mentioned that E$ may fall into the 1.26ish region as a target and we probably have seen it achieved that with the recent low of 1.2661. Just looking at the chart below, it is starting to show a possible bottom in the making after sessions of down move. The 100(brown)DMA seems to be supporting E$ and the probability of E$ rebounding to test the 200(blue)DMA at 1.2800/10 is high for now.
Order book: Updated1
Stop loss: 1.2650/55, 1.2680, 1.2700/05, 1.2800 and 1.2850
Limit: 1.2620/30, 1.2800 and 1.2850
Technically, intraday indicator is only around the 60% mark and there is enough scope for the E$ to push further. Intraday momentum remains firm and still pointing up. As we are still in the daily cloud, expect choppy price action.
For today, on a more conservative side, the trading trade is from 1.2700/10 to 1.2765/75 (first resistance) and then 1.2800/10. I still prefer to be on the long side until closer to the resistance.
All the best! Will update again if I see any other opportunities on other currency pairs.
 |
| E$ Daily chart - 21(Red), 100(Brown) & 200(Blue) DMAs |
USDCAD (1.0013)
This currency pair looks heavy and should drift to first support 0.9960/70 and then 0.9940/50. Risk above 1.0040.
Wednesday, 14 November 2012
Risk on!!!
Good afternoon folks!
Market rumour that funds will be released to Greece encouraged short covering in E$ to 1.2728 last night during the NY session. However, when no confirmation was received subsequently, market sold the E$ back down to 1.267ish only to be met with bids and it rebounded above 1.2700 to close at 1.2703. So far, most of the sell stops sub-1.2700 have been flushed and it seems like market is caught short E$ following a week of negative sentiment.
Notable orders:
Stop loss: < 1.2700
Limit: 1.2600/08 and 1.2620/30
EURUSD
Technically, short term intraday indicator is at o/b levels and market would consolidate lower from here at 1.2720. But overall intraday momentum has turned higher which has increased the probability of a near term bottom. This is further strengthened by the long-legged doji formation yesterday, following days of decline, which also increased the probability of a possible near term reversal. This would encourage a mean reversion to the 200DMA (Blue).
For today, expected range 1.2680/90 to 1.2790/810. I look to buy dip with risk below 1.2630.
SGDJPY
I have been monitoring this pair and recent price action has suggest a near term bottom been formed and strong upside momentum further confirmed by the RSI. Range may not be wide but quite manageable in terms of risk/reward. Look to buy dips. Support 65.15/25 and resistance 65.60/65 and 65.80/85
Market rumour that funds will be released to Greece encouraged short covering in E$ to 1.2728 last night during the NY session. However, when no confirmation was received subsequently, market sold the E$ back down to 1.267ish only to be met with bids and it rebounded above 1.2700 to close at 1.2703. So far, most of the sell stops sub-1.2700 have been flushed and it seems like market is caught short E$ following a week of negative sentiment.
Notable orders:
Stop loss: < 1.2700
Limit: 1.2600/08 and 1.2620/30
EURUSD
Technically, short term intraday indicator is at o/b levels and market would consolidate lower from here at 1.2720. But overall intraday momentum has turned higher which has increased the probability of a near term bottom. This is further strengthened by the long-legged doji formation yesterday, following days of decline, which also increased the probability of a possible near term reversal. This would encourage a mean reversion to the 200DMA (Blue).
For today, expected range 1.2680/90 to 1.2790/810. I look to buy dip with risk below 1.2630.
 |
| E$ Daily chart - Retesting the 200 DMA (Blue) |
I have been monitoring this pair and recent price action has suggest a near term bottom been formed and strong upside momentum further confirmed by the RSI. Range may not be wide but quite manageable in terms of risk/reward. Look to buy dips. Support 65.15/25 and resistance 65.60/65 and 65.80/85
 |
| SGDJPY - Daily chart with 21DMA (Red) and RSI |
Tuesday, 13 November 2012
Range tightens....
Good morning and happy Diwali to my Hindu friends! Its a public holiday here in Singapore.
EURUSD
Nothing concrete came out of the Eurogroup meeting yesterday which did not surprise many.
Order book is getting thin again with notable limit orders at 1.2620/30 and 1.2800/10. Stop loss orders were heard building up since yesterday at 1.2680/85.
Technically, E$'s inability to push higher and the consolidative price action has turned intraday momentum back down again. Though intraday indicator is nearing o/s levels but there is scope for some more downside.
Expected range for today: 1.2640/50 to 1.2720/30 with risk to 1.2745.
USDJPY
Expect further consolidation within 79.30 to 79.60/70. But USDJPY needs to re-capture and stay back above the 21 (red) and 200 (blue) DMAs to turn the picture bullish. Firm momentum, coupled with bullish divergence is supporting this currency pair but it would need to act fast before the upward momentum fizzles off. For today, I still prefer to buy the dip with risk to 79.00.
EURUSD
Nothing concrete came out of the Eurogroup meeting yesterday which did not surprise many.
Order book is getting thin again with notable limit orders at 1.2620/30 and 1.2800/10. Stop loss orders were heard building up since yesterday at 1.2680/85.
Technically, E$'s inability to push higher and the consolidative price action has turned intraday momentum back down again. Though intraday indicator is nearing o/s levels but there is scope for some more downside.
Expected range for today: 1.2640/50 to 1.2720/30 with risk to 1.2745.
 |
| E$ Weekly chart - Caught in between 21 (red) and 50 (green) WMAs |
Expect further consolidation within 79.30 to 79.60/70. But USDJPY needs to re-capture and stay back above the 21 (red) and 200 (blue) DMAs to turn the picture bullish. Firm momentum, coupled with bullish divergence is supporting this currency pair but it would need to act fast before the upward momentum fizzles off. For today, I still prefer to buy the dip with risk to 79.00.
 |
| USDJPY Daily chart - Still staying below MAs |
Monday, 12 November 2012
Day of rebounds...
Gooood Monday morning folks! Happy Veterans Day to our American friends!!
EURUSD
Last Friday saw the bears won the tug-of-war briefly by pushing E$ below 1.2700, tripping large stop loss orders to 1.2689 low before a mild rebound to hover around 1.2710/20. I have connected a few previous lows and highs to form a band (around 1.262ish to 1.269ish). Purpose of doing this is to show previous market reactions when close to these levels i.e. it is often rejected on first test. The large limit orders seem to reflect support this observation.
Notable orders just updated this morning:
Stop loss: 1.2690/00 and 1.2800-20
Limit: 1.2600/20, 1.2650/55 and 1.2700/05
As today is a U.S. federal holiday, I am not expecting a big trading range but instead a market consolidation of recent move.
Technically, intraday o/s environment, coupled with bullish divergence signal and weakening downside momentum would encourage short covering. Expected range 1.2680/00 to 1.2800/20.
USDJPY
This currency pair having fallen for the past few trading days should find reprieve today as technical indicators show signs of near term bottoming. A long-legged Doji (following several down sessions) , weakening downside momentum and bullish divergence signals have all increased the probability of a rebound. Expected trading range 79.20/30 to 79.80/90.
EURUSD
Last Friday saw the bears won the tug-of-war briefly by pushing E$ below 1.2700, tripping large stop loss orders to 1.2689 low before a mild rebound to hover around 1.2710/20. I have connected a few previous lows and highs to form a band (around 1.262ish to 1.269ish). Purpose of doing this is to show previous market reactions when close to these levels i.e. it is often rejected on first test. The large limit orders seem to reflect support this observation.
Notable orders just updated this morning:
Stop loss: 1.2690/00 and 1.2800-20
Limit: 1.2600/20, 1.2650/55 and 1.2700/05
As today is a U.S. federal holiday, I am not expecting a big trading range but instead a market consolidation of recent move.
Technically, intraday o/s environment, coupled with bullish divergence signal and weakening downside momentum would encourage short covering. Expected range 1.2680/00 to 1.2800/20.
 |
| E$ Daily chart - MAs cutting down and the band |
USDJPY
This currency pair having fallen for the past few trading days should find reprieve today as technical indicators show signs of near term bottoming. A long-legged Doji (following several down sessions) , weakening downside momentum and bullish divergence signals have all increased the probability of a rebound. Expected trading range 79.20/30 to 79.80/90.
 |
| USDJPY Daily chart - Long-legged Doji |
Friday, 9 November 2012
Short covering
TGIF friends!
E$ fell to a new recent low of 1.2717 overnight tripping some stops at 1.2720 before Asian sovereign bids came in to support the pair. Short covering this morning took the pair to a high of 1.2783 as market unwinds from its o/s condition. To add, there is a bullish divergent signal which can indicate a near term bottom but still pre-mature to confirm. As we have moved into the "cloud" on a daily basis, this kind of choppy price action is something we must be prepared for. Currently, we should be trapped within 1.2810/20 to 1.2710/20 and market will be keen to retest the 200DMA (blue).
Order book is getting busy with the following:
Stop loss: 1.2700-05, 1.2710, 1.2805-15 and 1.2820-25
Limit: 1.2610-20, 1.2650-55 and 1.2820-25
USDJPY (Y79.53): Recent rally to 80.67 was not sustainable as momentum fizzled, resulting in bearish divergence (see chart). This rejection above Y80 will continue to put pressure on this pair towards the 78.90/10 band in the near term with initial resistance at 79.60/70 (200DMA).
All the best and have a great weekend!
E$ fell to a new recent low of 1.2717 overnight tripping some stops at 1.2720 before Asian sovereign bids came in to support the pair. Short covering this morning took the pair to a high of 1.2783 as market unwinds from its o/s condition. To add, there is a bullish divergent signal which can indicate a near term bottom but still pre-mature to confirm. As we have moved into the "cloud" on a daily basis, this kind of choppy price action is something we must be prepared for. Currently, we should be trapped within 1.2810/20 to 1.2710/20 and market will be keen to retest the 200DMA (blue).
Order book is getting busy with the following:
Stop loss: 1.2700-05, 1.2710, 1.2805-15 and 1.2820-25
Limit: 1.2610-20, 1.2650-55 and 1.2820-25
 |
| E$ Daily chart - Retesting the 200DMA? |
USDJPY (Y79.53): Recent rally to 80.67 was not sustainable as momentum fizzled, resulting in bearish divergence (see chart). This rejection above Y80 will continue to put pressure on this pair towards the 78.90/10 band in the near term with initial resistance at 79.60/70 (200DMA).
 |
| USDJPY Daily chart - 200DMA to cap |
All the best and have a great weekend!
Thursday, 8 November 2012
More than a yard worth of E$ sold....
Good morning folks. Its the start of the Singapore Barclays Open!!!
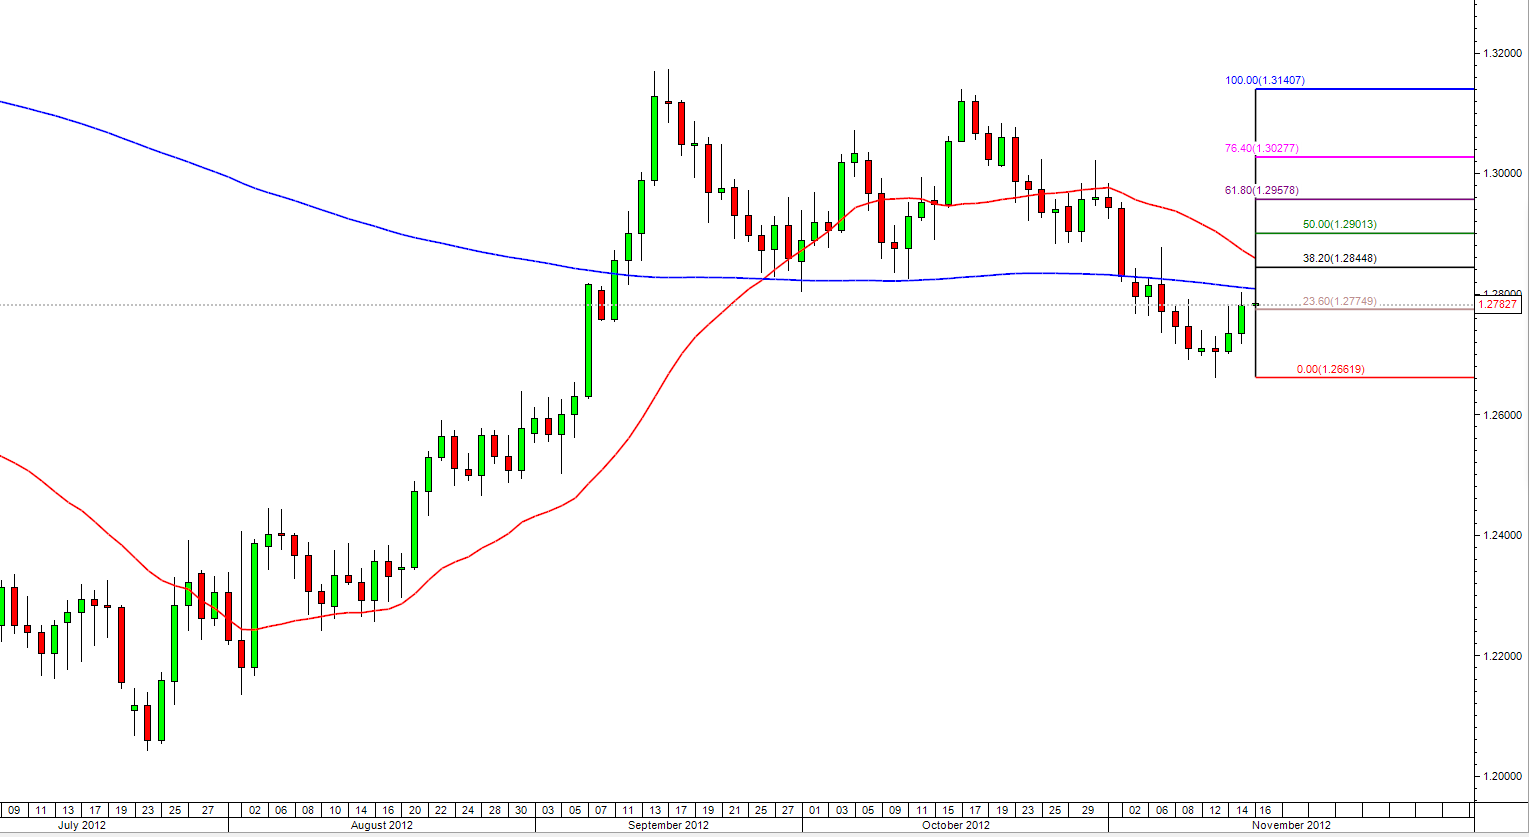
Indeed, market whipsaw as expected within the defined range ("Patience..." 6 Nov Tue). First, it was the Obama victory rally to 1.2876 and then subsequently plummeted on the comment by Mario Draghi. Heard an investment bank sold more than a yard worth of E$ tripping stops down to 1.2736 low (see chart, Fibonacci 38.2% retracement level) only to be met with bids from Asian sovereign name and some corporate demand.
Yesterday's price action took many by surprise as it flushed stops either way and left many bruised. That set me thinking of the worst case or most vicious and frustrating scenario from here to mentally prepare myself in case it really materialize i.e. a sharp rally from here to break yesterday's high and rally towards 1.29ish before it falls all the way back to 1.26ish by next week. That will flush the stop loss orders residing around the 1.2885 and 1.2890/00 area first.
This morning, Australia once again surprised market on the upside with its much stronger set of employment number of +10.7k jobs and rate at 5.4% vs expectation of +0.2K and 5.5% respectively. Obviously it sent the A$ flying and that supported E$ but with EURAUD lower.
Market focus is now turned to China's power transfer (but that should not have any surprises) and the woes in Europe (which market has reacted and built in the negatives for now).
Technically, bullish divergence has emerged and E$ does look like it has formed a temporary base at 1.2730/40 for a rebound to 1.2820/30 (first resistance). If the above scenario pans out, 1.2950/60 may be the ultimate target on the top end. Bearing in mind that on a weekly basis, the E$ remains bearish for 1.2610/50. Though there is 2 way opportunities, but for the conservatives, fading the rally above 1.2900 would appeal.
All the best!!
 |
| E$ 8-hourly chart - Initial bounce off 38.2% |
Wednesday, 7 November 2012
Longer QE!!
Okay, we now have the U.S. election behind us and Ben Bernanke is very likely to remain as the chief of Fed. No major changes as far as policies is concerned for the financial markets in the near term horizon. For now, President Obama had better get as much of his well deserved sleep because in the days ahead, his next challenge is to work with the Republican camp to quickly come out with solutions to avert the fiscal cliff come end of this year.
As expected, E$ reacted positively to the result and spiked higher to touch high of 1.2876 when the result was announced. Of course in hindsight, market has already factored in an Obama victory yesterday by buying up risky assets and E$ closed with a tweezer pattern (circled).
Meantime, let the market celebrate "for longer QE" before the attention is swung back to the problems in Europe.
Order book is starting to get busy again:
Stop loss: 1.2740, 1.2885 and 1.2890/00
Limit: 1.2750/60
Technically, intraday indicator and momentum have all turned higher increasing the probability of a near term bottom being formed. The short covering may take us back to the 1.2950/70 region to retest the trend line but I remain skeptical that E$ can sustain this rally as the weekly chart remains bearish for now. EURAUD continue to look heavy as market switched to risk loving mode. I still maintain the wide range I mentioned yesterday, which is 1.2600/50 to 1.2960/80. We are stucked just below first resistance at 1.2870/80 for now. For today, I prefer to be fading into rallies but would stay patient for now.
All the best!
 |
| E$ Daily chart - Retesting trend line |
Tuesday, 6 November 2012
Patience.....
Good afternoon, folks!
You mean you guys are planning to trade today? My advise is to stay out and try not to pre-empt the market reaction to the election result.
Clearly, most participants are already out of the market. It is evident in the order book. I have hardly seen it as bare as it is now.
Technically, bullish divergence signal has emerged and that has increased the probability that E$ might have found a temporary bottom for now. E$ is currently staying below the 200DMA and 50WMA and the weekly trend has turned bearish. A falling EURAUD is also adding pressure on E$. As I have mentioned yesterday, market has moved in such a way that it has left room for a short squeeze but within a near term downtrend.
A potential range which I think market may whipsaw within for the next 48 hours... 1.2600/50 to 1.2960/80 on wide on first test.
All the best!
DMA = Daily Moving Average
WMA & MMA = .........
You mean you guys are planning to trade today? My advise is to stay out and try not to pre-empt the market reaction to the election result.
Clearly, most participants are already out of the market. It is evident in the order book. I have hardly seen it as bare as it is now.
Technically, bullish divergence signal has emerged and that has increased the probability that E$ might have found a temporary bottom for now. E$ is currently staying below the 200DMA and 50WMA and the weekly trend has turned bearish. A falling EURAUD is also adding pressure on E$. As I have mentioned yesterday, market has moved in such a way that it has left room for a short squeeze but within a near term downtrend.
A potential range which I think market may whipsaw within for the next 48 hours... 1.2600/50 to 1.2960/80 on wide on first test.
All the best!
 |
| E$ Weekly chart - Fibonacci levels at a glance (21WMA - Red, 50WMA - Green) |
WMA & MMA = .........
Monday, 5 November 2012
What a week!!
Good Monday morning folks!! I would like to take this opportunity to congratulate Kimi (my favorite driver) for his first win since his return to F1 just this season!
This week.... will be one heck of a week with the U.S. election tomorrow, the Chinese leadership transition and the Barclays Singapore Open taking place from Thursday!!
So let's focus on the U.S. first.... by the way, how many of you are guilty of not knowing the meaning of "fiscal cliff"? Here's a little help... it is a popular shorthand term to describe the conundrum that the U.S. government will face at the end of 2012, when the terms of the Budget Control Act of 2011 are scheduled to go into effect. You can read more on the terms here at
http://bonds.about.com/od/Issues-in-the-News/a/What-Is-The-Fiscal-Cliff.htm
Last Friday was a disappointment as I was expecting a bounce before the sell-off but it did not materialize after it fell through the support. Am glad I had a tight stop placed.
For today, I have to warn that market can be choppy but pressure is on the E$ at this stage basing on the weak close last Friday and for the week. However, there is a risk of an intial mild short squeeze before it resumes its slide.
Most of the sell stop loss orders had been flushed last Friday and we are nearing the previous low of 1.28034. I have no updates on the latest orders but from last, noteworthy limit orders can be found at 1.2780 and 1.2800/05.
CFTC speculator accounts revealed that E$ net short has increased to -58,207 vs -55,219 and net short JPY jumped to -37,020vs -18,196.
Technically, intraday indicator is in the o/s zone and intraday momentum is starting to turn higher. Initial support at 1.2800/05 should hold for now and a rebound to 1.2870/90 is expected during the Asian to early European session. There is a small possibility of market squeezing up to 1.2960/70 but will be keen to fade into this rally for 1.2800 to be retested. General trend for the week basing on the available technical signals is down but remember that this week can be more fundamentally driven. So be prepared for a choppy market and advise all to have stops in place and stay very nimble.
All the best and have a great week ahead!!
 |
| E$ Weekly chart - Mean reversion to 21WMA? |
Friday, 2 November 2012
Gearing for election....
TGIF!! I will be watching "Skyfall" when U.S. announces their employment numbers today at 2030hr (Sin/HK). Remember what I have mentioned before ("Trapped again...." 31Oct) on how the market's potential knee-jerk reaction?
Asian sovereign interest was heard at around 1.2920/30 yesterday and that supported the rebound to 1.2982 in the NY session. I don't think it was a structural play but more of an opportunistic move. Though price stayed range bound, it has slipped below the trend line again and this has given the bears an advantage for now. Cross referencing the daily chart of EURAUD, this currency pair has already stayed below the 50DMA and this further add weight on euro. Though on the weekly chart, E$ continues to stay bullish but like I have mentioned, recent price action has positioned itself for a possibility for a break for 1.26ish. The U.S. election, major risk event, will dictate the short term move of currencies.
Latest order book update revealed the following:
Stop loss: 1.2840, 1.2860-80, 1.2920/25, 1.2985/90 and 1.3010/25
Limit: 1.2880/85, 1.2920/25 and 1.3010/25
But it is starting to become a bit more lopsided after E$ has been rejected a couple of times below 1.3000.
Technically, intraday indicator is in o/s zone though not extreme but would have increased the probability of a rebound upon any sell-off here. Market is caught between the 21DMA (red - 1.2973) and 50DMA (green - 1.2885) and this should dictate the range for today. Momentum continues to point towards range consolidation and guess this will probably be the way into the election next week.
For today, I see 2-ways trading opportunity. From Asian to European session, trade 1.2910/20 to 1.2970/80 range on first test. From late European to NY session, 1.2970/80 to 1.2880/90.
Expect market liquidity to be sub-optimal and therefore characterized by whipsaw price action, so stay nimble and have a trailing stop to protect your profit. All the best and have a great weekend!
 |
| E$ Daily chart - Still trapped in between 2 DMA |
Thursday, 1 November 2012
No show hand....
Good morning, folks! Hope all enjoyed the Halloween celebration last night. Anyone can tell me who will be the happiest group of people after the trick or treat (mainly treat!)? Nope, not the kids.... (answer below the chart).
Once again, the market refused to show its side the obvious manner. It closed an inverted hammer and below the 21DMA (red) following a Tuesday's bullish piercing pattern and this should put initial pressure on the E$. However, the underlying bullish tone is garnering more support technically by the day:
(the dentists!!)
Once again, the market refused to show its side the obvious manner. It closed an inverted hammer and below the 21DMA (red) following a Tuesday's bullish piercing pattern and this should put initial pressure on the E$. However, the underlying bullish tone is garnering more support technically by the day:
- Price staying above the 50DMA (green) and lower trend line.
- 50DMA has also cut above the 200DMA (blue) last Friday.
- Daily and weekly momentum are also pointing higher
Do note that an inverted hammer is NOT a reversal signal. However, it is an indication that the bears had an upper hand towards the closing.
Order book from last evening:
Stop loss: 1.2850, 1.2870, 1.2880/85, 1.2970 and 1.3020/25
Limit: 1.2880/85, 1.2910/25 and 1.3020/25
Technically, another day with a mixed bag of signals:
- Bullish divergence has emerged in the intraday momentum and this should provide support amid a mildly o/s condition.
- Stops at 1.2970 will attract attention but initial resistance at 1.2980/90 should cap for now.
- Notable buyers and sellers defined the range of 1.2880/90 to 1.3020/30 for now with intraday momentum supporting a consolidation mode.
I would trade the defined range but prefer to buy on dip for today and will patiently wait for market to test the 1.2890/1.2910 and look to take profit around 1.2970/80.
All the best and stay nimble as we approach the apex of this consolidation.
 |
| E$ Daily chart - Bulls still have upper hand |
Wednesday, 31 October 2012
Trapped again....
Good morning folks!!
US market will be opened today in time for the month end closing. But do note that month end positioning can create erratic price pattern especially during the NY session as they are the one closing the trading day.
This Friday's US employment numbers will be crucial as it can in a small way sway some voters either way. A strong positive number will help Obama and a weaker-than-expected number to Romney. As I have mentioned before ("U.S. Election result to dictate...", 22 Oct 12) that this period prior to the U.S. election, as long the polls show a split, market will stay range bound and how either incumbent wins, the impact it has on E$.
From a strictly technical point of view, E$ is staying above pivot levels in the longer term chart, at this moment, to allow bulls to have an upper hand. My take is... an Obama win should see E$ break up from its consolidation into the 1.32/3400 band since Ben Bernanke will be around for a while to continue with QE Infinity. However, a Romney win can send E$ down to 1.26ish level first before a rebound. Shall watch.....
Order book as of this morning:
Stop loss: 1.2840, 1.2870 and 1.3020/25
Limit: 1.2880/85, 1.3000/10 and 1.3020/25
Technically, from intraday to the daily chart, E$ is stucked like in between a whole series of moving averages and other technical supports and resistances. Shorter intraday momentum is pointing to consolidation to down with nearer resistance at 1.2980/90. Daily close yesterday still below 21DMA (see chart) but bounced off the 50DMA. Intraday bullish divergent signal and backed by a daily bullish piercing pattern on the candlestick should continue to back a E$ recovery.
For today, during Asian to European session, look to sell rally, with tight stop above resistance, and take profit above support at 1.2920/30. Abandon trade idea if 1.2920/30 is seen first. Then look to buy dip on first test of the 50DMA + lower trend line around 1.2870 and take profit 1.2920/30.
All the best. Stay nimble and infront of your screen if you are to scalp.
 |
| E$ Daily chart - Still trapped |
Tuesday, 30 October 2012
Full moon....
Good afternoon folks! Update from tomorrow should be back to normal timing. This is in no way an indication that I will be stopping my blog :)
Frankly, like it or not, currencies need to take some direction from the U.S. market though of course corporate orders can still be channelled for execution through their Asian/Ldn offices. Liquidity is definitely sub-optimal and is susceptible to whipsaw price action. This is made worse by the fact that we are in the full moon zone. I have to admit that I am not exactly too keen to engage the market because technical analysis works best in a liquid environment and there will be anomaly like the month end closing which can affect the market differently.
Update on order book today:
Stop loss: 1.2870, 1.2950/60, 1.2980 and 1.3020/25
Limit: 1.2880/85, 1.3000 and 1.3020/25
Technically, intraday momentum is pointing firmly higher coupled with a bullish divergent signal (see chart). This has increased the probability of a base being formed around the 1.288ish level. However, I have to give certain amount of discount on the strong momentum from the surge from the 1.289ish to 1.2949 as market is illiquid.
I remain conservative and will await to buy dips to 1.2840/60 with a tight stop and take profit around 1.2900/20 for today, if I have to trade.
All the best!
 |
| E$ 2-hourly chart - Bullish divergence |
Monday, 29 October 2012
Tricky conditions....
Good afternoon, folks! Apologies for the late update. Completed the first half but had to rush out to meet friends from overseas and only just got back about an hour ago.
Hope everyone had an enjoyable Halloween weekend. But definitely not forgetting our friends living around the North Eastern shore of the U.S. of America as Hurricane Sandy heads for landfall within the next 24-36hrs. Do take care!
Admittedly, I have hardly been tricked by the market twice within a week, but I was last week. In view of that, it is getting apparent that market liquidity is probably sub-optimal (made worse today by the shutting of the US market today) and getting jittery ahead of the U.S. election. Understanding that we are already into that zone before the huge risk event, I will have to change my trading strategy and adapt accordingly in this environment by increasing the notional amount marginally and trade within a tighter range instead of the wider expected daily range (i.e. within support/resistance).
CFTC speculative accounts showed that net euro short contracts have increased very marginally to -55,219 vs -53,495. Net short jpy has flipped to -18,196 vs +10,086.
Order book from last Friday revealed the following:
Stop loss: 1.2880 & 1.3025
Limit: 1.2800/05, 1.2850, 1.2880 and 1.3000
Technically, intraday indicator is nearing o/s level though not at extreme. Intraday to daily momentum continues to point lower though the weekly is still pointing higher (may be lagging). There are conflicting signals and that is not totally unexpected at this stage. However, a few signals will continue to weigh on E$ at this point in time:
- Price unable to stay above the 21DMA (see graph).
- If price action continues to hover around current levels, it will soon trade below the rising trend line.
- Bearish divergent signal has already emerged on EURAUD which has increased the probability that it has formed a top and in its counter-directional move i.e. down.
For today at this point (1.2898), expected range 1.2830/40 to 1.2960/70. I would look to buy on dip closer to 1.2830/40 on first test for a bounce for 1.2880/90 with a tight stop. For the next few days into the U.S. election, I will be adopting smaller range scalping
 |
| E$ Daily chart - Retested 21DMA but above rising trend line |
Friday, 26 October 2012
Apex!
TGIF and Selamat Hari Raya Haji to all my Muslim friends!
Kinda like an up and down day for me yesterday but overall happy. Just to share what I did for the purpose of learning. Reference the expected range from "Resilience..." (25 Oct Thu). Bought the E$ around the lower band and took part profit at the first resistance (down trend line - see graph). As bearish divergence emerged, I squared the remaining long E$ position higher than the first. Awaited for the dip and bought in again but this time in a smaller notional with a tighter stop and was hoping for the pair to test the stronger resistance. As E$ price action started to look uncertain, I decided to cut loss ahead of the stop on the 2nd position with a small loss. Net profit for the day. This is another lesson on how one should protect their profit based on the logic of reducing notional amount as you chase the market higher as the probability of winning reduces - inverse relationship. An important area in successful trading is in the ability to protect profits and limit the losses (though an obvious but many got carried away and allowed emotion to take over).
Clearly from the stop loss orders, market is quite torn on the eventual direction of E$ in the next 18hrs:
Stop loss: 1.2850, 1.2880, 1.2920, 1.3000, 1.3010 and 1.3040.
Technically, intraday indicator is at pretty neutral levels. Intraday to daily momentum continue to point to consolidation to lower though the weekly continues to point higher. More conflicting signals: E$ closed below the DMA21 (though already flirting that level for the past 3 days) but still above the longer term rising trend line (see graph).
In summary, I have this trading principle to avoid engaging the market when around the apex where we are right now. Allow the market to show its side, patience will pay in the long run.
I will be out with my family to the beach since its a public holiday in Singapore today. Will be back for Europe session later and will update the blog if anything.
All the best!
Update1: The breakdown has materialized. Rejected on retest of the DMA21 and broke the rising trend line have increased the probability significantly. E$ should be targeting 1.2830/40 level today.
 |
| E$ 8hourly chart - Rejected back and forth |
Thursday, 25 October 2012
Resilience...
Good morning, folks!
Tricky move on the E$ yesterday (as far as I am concerned) as it took a deeper dip to test the rising trend line (see graph). Admittedly, it was one of those days where I was caught off guard by the move and was almost swayed once it broke through the 1.2950/60 level. However, I am so glad I stucked to my discipline. That is, in the event when stop is triggered, do not jump back into the market on impulse, emotion must be controlled. Take time to analyze the latest technical signals as per how I would each and every single time especially when the move was unexpected. That premature bullish divergent signal I mentioned in my update prevented me from turning short. Not trying to be philosophical here but to share an important lesson to learn.... one can only get profitable only after you know how to limit your losses.
Update of the order book this morning revealed the following:
Stop loss: 1.2880, 1.2920, 1.3000 and 1.3010
Technically, intraday momentum has turned and broken higher on the back of the bullish divergence. With a close back above the daily MA21 again, a "doji" candlestick pattern was formed. These signals have increased the probability for higher E$ today. As long as E$ stays above the rising trend line (see graph), the prospect of 1.3170 being retested remains realistic. However, one has to be aware that EURAUD does look heavy for now.
For today, I would attempt again to buy the dip with risk to just below yesterday's low of 1.2920. Expected trading range 1.2960/70 to 1.3010/30 (1.3030/40 stronger resistance).
All the best!
 |
| E$ 8hourly chart - If this trend line holds |
Wednesday, 24 October 2012
Ifo & FOMC to dominate...
Good morning, folks!
Indeed, the early warning signal from USDSGD and USDJPY has helped to guide my read on E$ (U.S. election result to dictate... 22 Oct Monday). Basically, the NY session was dominated by stop loss seeking as it wasted no time to plough through to 1.2952 where strong bids emerged. 61.8% fibonacci retracement level at 1.2946 is deemed to have been achieved. As I have found out from experience that certain candlestick pattern can be doubtful when market is caught within a range consolidation and therefore one has to adjust the weightage accordingly in different situations. Highlight for today will be the German Ifo business climate number this afternoon at 1600hr (Sin/HK) and FOMC at 0215 and 0400hr (Thursday).
I have not received updates on the order book yet but based on yesterday evening's remaining orders:
Stop loss: 1.3085, 1.3100 and 1.3120
Limit: 1.2950 and 1.3130
Technically, shorter term intraday indicator is at o/s level and the past hours of uptick is starting to unwind that situation. Intraday momentum is starting to turn from down to consolidation. Though E$ closed near to the lower day range, it still managed to stay above the 61.8% fibonacci level and daily MA21. I have various bullish signals from here but countered by the bearish engulfing candlestick pattern.
In summary, though there are conflicting signals but I prefer to go long E$ for today. Expected trading range 1.2950/60 to 1.3040/50 (1.3090/3100 expanded) within a wider 1.2800 to 1.3170.
All the best!
Update1: Went long E$ but got stopped out with tight stop. E$ having broken through 1.2950/60 may open up 1.2820/30 now but there is a premature bullish divergent signal on the momentum as it bounced mildly off a rising trend line at 1.2920. Staying out for now and await new signals. But for now, the bears have an upper hand at 60/40. Watch EUR/AUD as I see the recent uptrend has probably ended.
 |
| E$ 2hourly chart - Close to 61.8% correction target at 1.2946 |
Tuesday, 23 October 2012
Fundamentals eclipse technicals...
Good Tuesday, folks!
In my update yesterday, I mentioned about increasing IPOs and M&As are prelude to stock market top. I have friends asking if its imminent. My answer is quite simple, I will not be able to put my finger on the date, but it is an early signal. Google and read on the reasons for previous market crashes and one will gather that there had been a consistent pattern besides interest rise. However, I do not see a sharp selloff if that was what many would tend to expect. Instead it may be a long protracted downturn as we are not as leveraged as we used to be. It can be sharp if central banks decide to drain the liquidity out of the market after years of quantitative easing but that should not be the likely scenarion for now.
If stock markets were to turn down, does that imply that the USD will move higher? My answer will be.... not necessarily as this correlation could break down. We can discuss on this topic the next time.
For now, market will be watching closely the U.S. poll results as we get nearer to election day, as it can affect the currency positioning ahead. Based on current level, E$ has factored in QE Infinity, a Mitt Romney victory can drive the E$ down to 1.26ish. But that may not imply a change in underlying bullish E$ trend that I continue to subscribe to. If poll results are not showing any clear signals whatsoever, the probability of E$ trading within 1.2800 to 1.3170 is high.
No update on the market order book for now and these information is based on what had been gathered the evening before as an indication:
Stop loss: 1.2990-93, 1.3000 and 1.3100
Limit: 1.2980 and 1.3000 (see graph)
Technically, shorter intraday indicator is close to extreme o/s level and that should provide some support for now. Momentum is suggesting consolidation, but since price is close to the lower band, there should be some support around the 1.3010/20 for a rebound. This scenario is also supported by the daily bullish piercing pattern. The only conflicting signal is the break in the trend lines (see graphs below).
In summary, I shall maintain trading the range with a skew to favor selling into rallies. The expected trading range for today 1.2990/3010 (1.2960/80 news induced) to 1.3100/10 on first test. Remember to stay disciplined and nimble in a more fundamentally driven market ahead.
All the best!
 |
| E$ 2hourly chart - Trading below trend line |
Monday, 22 October 2012
U.S. Election result to dictate...
Good Monday morning folks!!
Market has decided not to show its side the whole of last week as E$ continues to stay above pivot of 1.2990/3000 and below 1.3170. Focus this week should be this Wednesday's German Ifo Business Climate report at 1600hr (minor) and main focus on FOMC (Sin/HK Thursday 0215hr/0400hr) though I don't see how much this FOMC will add value since Fed is already on unlimited QE.
So chances are that we will be 'stucked' within the recent defined range until after the U.S. election on the 5 November 2012.
A couple of scenarios I have been thinking about to better prepare me in reaction:
1. Anticipation of a Mitt Romney win or the initial impact of an actual win will be USD positive. Why? Romney is very likely to fire Ben Bernanke and end the unlimited QE. At least for now, market finds him to be more pro business vs Obama's tax hike plan.
2. Anticipation or an actual win by Barack Obama will see E$ break out of its recent range continuing with its current trend as the recent Fed's decision will be here to stay.
Do note that this election is a major fundamentally driven event and it can throw technical rhythm off momentarily.
CFTC speculative accounts update showed that net euro short positions have been reduced to -53,495 from -72,570. This could be the result of the early week short squeeze and subsequently market was no longer keen to take on directional trades.
Noteworthy orders are as follow:
Stop loss: 1.2970/80, 1.3000, 1.3013, 1.3100/06 & 1.3150
Limit: 1.2950, 1.2970/80 & 1.3150
Technically, intraday indicator is at pretty neutral zone. But momentum is exhibiting a mixed bag of information across the different time intervals. The shorter term momentum is pointing to consolidation but with price at the lower band of that range, there is scope for uptick. However, daily momentum is pointing lower but the weekly is still pointing firmly higher (though can be lagging).
In summary, tough call but will go ahead and trade the range of 1.2990/1.3000 to 1.3100/10 on first test.
All the best and have a nice week ahead. Tomorrow's update will be delayed :)
Update1: Just thought I shared a couple of observations.
1. Last Friday after golf, one of my golf mates exclaimed that there are so many IPOs to choose from nowadays. Today in Singapore Business Times headline 'IPO pipeline hots up for Q4 burst'. History has it that prior to every stock market down trend, there were always that period where IPO hots up and accompanied by mergers and acquisitions. First sign?
2. Breakup momentum in USDJPY and USDSGD is good signal and may last into the U.S. election. This should be good early warning on how we should position for E$.
 |
| E$ 8hourly chart - Range ahead of U.S. election |
Subscribe to:
Comments (Atom)