Thursday 12 September 2013

E$ supported by the crosses...

Reference "Awaiting for stronger signals....", 10 Sep, E$ rebounded after low of 1.32295 and high so far 1.3325, pausing after it achieved the 61.8% fibo correction. This has completed the next wave I anticipated. Important to note too is the emergence of the bearish divergent signal (see chart) but still premature to confirm. Though E$ has closed above the DMA21 at 1.3289, I am still refraining from getting too bullish. Additional support comes from the rebound in the EURxxx (sent tweet out yesterday to warn against getting too bearish EURxxx for now).

Europe order book:
Stop loss: 1.3330
Limit: 1.3230/20 and 1.3325
Order book looks very boring and therefore I do not expect anything exciting out of E$

Primary trend: Bullish
Intermediate trend: Bearish for 1.3000 (invalidated if 1.3452 breached)
Minor trend: Consolidation with slight upside bias

Technically, E$ is slowly nudging the intraday indicators into o/b zone, though not extreme yet. Intraday momentum continues to point higher. Combining other technical signals, I prefer to trade on the short side when nearer 1.3350/60. However, one would have to observe for fading intraday momentum. Expected range 1.3280/90 (1.3250 extended) to 1.3350/60.

E$ 2hourly chart - Bearish divergence around 61.8%

Tuesday 10 September 2013

Awaiting for stronger signals....

Market reacted according to Scenario 1 (ECB dictates first...., 5 Sep13) with a low of 1.3104 before the rebound to high of 1.3281 so far. This has completed the wave I expected and anything from here could be a grind and with lesser certainty until the next lead.

CFTC COT report: Speculator's accounts as of 3 Sep 13
EUR    +40,081 vs  +22,738
JPY      -78,353 vs   -79,761
AUD   -71,117  vs   -71,501

Europe order book:
Stop loss: 1.3215, 1.3225, 1.3295 and 1.3310/20
Limit: 1.3100 and 1.3150/60

Primary trend: Bullish
Intermediate trend: Bearish
Minor trend: Mildly bullish

Technically, shorter intraday indicator is slipping into o/s but longer ones are still in o/b zone. Shorter intraday momentum is suggesting consolidation but longer ones are still pointing higher. Expect E$ to test the 1.3200/20 area before rebounding for 1.3300/20 again. Thereafter, I will step aside and watch to sell if it gets to 1.3350/70.

E$ 2hourly chart - 50% fibo achieved, watching 61.8%.... 

Thursday 5 September 2013

ECB dictates first...

Technical readings have flipped and probability for higher E$ has increased. Obviously the nearer event risk has to be ECB's rate announcement and the ensuing press conference at 1945 and 2030hrs (Sin/HK) respectively. Market at this moment has factored in no action from ECB.

Possible reactions:
Scenario A: ECB cuts rate by 25bps or bearish outlook - retest of 1.3138 but 1.3100/10 should hold for a rebound for 1.3270/3300.
Scenario B: ECB cuts rate by 50bps - sharp sell-off but 1.3040/50 to hold for rebound
Scenario C: ECB left rate unchanged - 1.3160/70 to hold for rebound for 1.3270/3300

NY order book:
Stop loss: 1.3145-30, 1.3250/60 and 1.3310/20
Limit: 1.3220/25

Primary trend: Bullish
Intermediate trend: Bearish
Minor trend: Mildly bullish

Technically, shorter intraday indicators are unwinding its o/b condition. Intraday momentum suggest consolidation between 1.3170/80 to 1.3200/20. Suggest risk below 1.3090 for take profit at 1.3250/60 and 1.3290/310.
E$ 2hourly chart - 

Tuesday 3 September 2013

Awaiting signals....

Follow through sell pressure from the weak close last week should see E$ continue to probe the downside but one cannot get overly bearish when nearer the support band 1.3100-30. Upside handle 1.3230, if cleared, should open up for 1.3300.

These are the rest of economic data for the day (timing in Sin/HK):
2100   US Final Manufacturing PMI
2200   US ISM Manufacturing PMI
Of course, the market's main focus is the US employment numbers this Friday.

CFTC COT report: Speculator's accounts as of 27 Aug 13
EUR   +36,746 vs  +40,081
AUD   -63,183 vs  -71,117
JPY     -71,721 vs  -78,353
Specs are still adding on to long Euro positions!

Europe order book:
Stop loss: 1.3250/60, 1.3310/20 and 1.3345
Limit: 1.3150/45

Primary trend: Bullish
Intermediate trend: Bearish
Minor trend: Initial downside pressure but susceptible to shortcovering

Technically, shorter intraday momentum is suggesting consolidation but longer intraday is still pointing lower. Do note that bullish convergence signal has emerged but still premature to ascertain a bottom yet. I expect minor whipsaw price action and prefer to trade from the long side. Shall observe how the momentum unfold in the next 4-8hrs for more confirmation.

E$ 8hourly chart 


Friday 30 August 2013

Liquidity is back!!

Next Monday is Labor Day in the US and it marks the unofficial end to summer. Not coincidentally, it also implies a return of liquidity to normality which we have already noticed in the past couple of trading sessions.
Just take note that today is the last day of August and month end flows can disrupt the regular rhythm of the market.
Quite a good spread of data to keep the market engaged (All in Sin/HK time)
1400hrs  German Retail Sales
1600hrs  Italian Employment data
1700hrs  Eurozone CPI Flash Estimate + Unemployment rate
2030hrs  US Core PCE Price Index
2145hrs  Chicago PMI
2155hrs  Revised UoM Consumer Sentiment

CFTC COT report: Speculator's accounts
               31 Jul             6 Aug            13 Aug          20 Aug
EUR      - 8,504           + 6,061          +16,057         +36,746
AUD     -72,573          -76,779           -62,721          -63,183
JPY       -82,135          -80,213           -74,462          -71,721
Not surprised by the turnaround in E$ when spec accounts have such a directional bias.

NY order book:
Stop loss: 1.3185/80, 1.3205/00, 1.3300, 1.3345/55 and 1.3395/405
Limit: 1.3185/80, 1.3205/00 and 1.3395/405

Primary trend: Bullish
Intermediate trend: Bearish
Minor trend: Consolidation with upside bias

Technically, the downside easy money is probably over for now. Shorter intraday indicator is getting close to o/b but longer intraday is at o/s levels. Shorter intraday momentum is starting to indicate waning downside momentum whereas the longer ones are still pointing lower. Taking other technical readings into consideration, the most likely outcome: a potential test at yesterday's low of 1.3219 but 1.3180/90 should hold for rebound.
Based on current development, E$'s 1/2 weeks technical picture remains bearish for 1.3100 but for today, one should not get overly bearish when closer to 1.3200.
With this scenario, one can attempt a speculative buy dip with tight stop below 1.3150 on first test (before 1.3300 is seen). Sell rally can probably be held back till next week.

E$ Monthly chart - 2 possible Intermediate trend

Monday 12 August 2013

USD has run its course?

Back after a short break and here's what I see unfolding:
1. These recent months of USD bull run is probably at its tail end or already run its course.
2. Euro, the quasi-USD, may soon feel the pressure as EURxxx start to correct the recent months of bull run.
3. If a major reversal is imminent, how does that correlate with the equity markets?

CFTC COT report: Speculator accounts as of 6 Aug 13
EUR:  -  8,504 vs  + 6,061
AUD: -72,573 vs   -67,797
JPY:   -82,135 vs   -80,213
Note: EUR has finally swung into net long. A$ and USDJPY are susceptible to short squeeze and long liquidation respectively.

Europe order book:
Stop loss: 1.3285/75, 1.3425 and 1.3450
Limit: 1.3235/30, 13300, 1.3350/55, 1.3390/400, 1.3410/20 and 1.3480/85

Primary trend: Bullish
Intermediate trend: Bearish for 1.2800/50
Minor trend: Mildly bearish

Technically, shorter intraday indicators are in o/s territory which could provide support at 1.3300 for now. However to note, the longer intraday still has room and the daily/weekly indicator are still in o/b zone. The dark-cloud cover candlestick pattern on Friday and the bearish divergent signal have both increased the probability of a near term top. Expected range 1.3350/60 to 1.3230/50.

E$ 8-hourly chart - Bearish divergence in the mature stage

Thursday 1 August 2013

E$ resisting in a strong USD environment...

E$ continues to resist against the USD strength on the back of firm EURxxx, notably EURAUD. At the current level of 1.4800, I believe EURAUD still has another wave higher (potentially 1.5350/5400) to complete this recent rally before a meaningful correction. This should provide us the cyclical timing as to the reversals of both E$'s near term top and A$'s near term bottom. After this EURAUD's parabolic surge, a subsequent correction back towards 1.43/4400 is expected in the weeks' ahead.

Do note that the USD index continues to look firm and I would expect the greenback to appreciate against most currencies at least in the first half of August. With that, USDJPY should get a boost for 101.50/102.00 with strong support at 97.00/50.

CFTC COT Report: Speculator's accounts as of 23 Jul 2013
EUR:   -27,900 vs -37,165
JPY:    -87,496 vs -85,762
AUD: -63,982 vs - 70,686

Europe order book:
Stop loss: 1.3165/50, 1.3210/00, 1.3350/55, 1.3380 and 1.3420
Limit: 1.3165/50, 1.3210/00 and 1.3345/50

Primary trend: Bullish
Intermediate trend: Bearish for 1.2800/50 (to be reviewed if 1.3416 breached)
Minor trend: Range ahead of US employment data tomorrow

Technically, shorter intraday indicators have slipped into o/s level while the longer ones are only just coming off the o/b zone. This may suggest limited downside with an increased probability of overnight high being retested. Intraday momentum indicators suggest a high probability of range consolidation with an initial bearish divergent signal which is still too premature to put heavier weightage on. But do note that the daily indicator is still pointing firmly higher which should caution one against going aggressively short in the E$ just yet. Expected trading range 1.3320/30 to 1.3220/30 (on first test only).

E$ 8-hourly chart - Initial bearish divergent signal, still premature.......
AUDUSD
Last update "Are we done yet?", 24 Jul 13, I have warned of a potential bounce in A$ around 0.8870/900. However, based on current development, price remains heavy and A$ looks vulnerable for 0.8600. Strong resistance 0.9100/20 should cap any rebound for this round. At this point in time, the cyclical timing seems to coincide with the EURAUD view above. Will update if new signals emerge.
A$ 8-hourly chart - Price action remains vulnerable to the downside 

Friday 26 July 2013

Shaken but not out!

Overnight, E$ defied gravity and continued its relentless grind higher soaking up heavy supply and triggering buy stops. The price action was unusual as I witnessed the rally last night. Despite the dark cloud cover candlestick pattern, E$ replied with a very potent turnaround with the daily range totally engulfing the day before (remember, no certainty?). For this, I must admit I was not mentally prepared for and will take a step back, let the market unfold a little further before I commit to a minor trend view.
Having said that, I still maintain that E$ remains susceptible around these levels for a very quick snap back, which has a higher probability of materializing in August.

Europe order book:
Stop loss: 1.3165/50 and 1.3305
Limit: 1.3165/50, 1.3300, 1.3320/25 and 1.3340/50

Primary trend: Bullish
Intermediate trend: Bearish for 1.2800/50 (to be reviewed if 1.3416 breached)
Minor trend: Mixed

Technically, intraday and daily indicators are all in o/b levels. However, I receive mixed signals on the intraday momentum indicator at this point in time (1.3275) with some showing further upside momentum but contradicted by a bearish divergence signal. This should hold us back from turning overly bullish in case the E$ went for another spurt towards the trendline resistances (1.3340/70) tonight.
For the diehards, I recommend a scaled down notional for a speculative sell at 1.2330 with a stop above 1.3416 for a take profit at 1.3230. Its Friday, remember your trailing profit stop!

E$ Daily chart - Trendline resistance...

Thursday 25 July 2013

Reversal pattern = Checked!!

Like it or not, for E$, most reversals were preceded by either a bullish/bearish engulfing or dark cloud cover/piercing candlestick patterns (see chart). After studying the intraday price action and confirmed by a daily dark cloud cover candlestick pattern, the probability of E$'s recent rally hitting a wall has definitely increased (nothing is certain in the financial market!) However, as we slip into the daily Ichimoku cloud, we must be mentally prepared for some back and forth price action until we break free below the 1.3100 big figure where we then have to contend with the bunch of daily moving averages (DMA200/50: 1.3079, DMA 21: 1.3047 and DMA100: 1.3027).

No updates on the order book today.

Primary trend: Bullish
Intermediate trend: Bearish for 1.2800/50
Minor trend: Mildly bearish

Technically, shorter intraday indicator has come off its o/b zone but the longer intraday and daily indicators are only just starting. Upside momentum has waned and downside momentum is building up.
Expected range 1.3230/40 to 1.3100/20 (expanded 1.3060/80).
E$ Daily chart - Reversals
Read my update "Are we done yet?", 24 Jul 13, for AUDUSD view.

Where art thou going, my precious metal?

Since my last writeup "Initial target hit, whatz next for XAUUSD?", 15 Apr 13, the yellow metal has touched my 2nd target and its time for another update.
To give all a sense of proportion and perspective, I have included a multi-year monthly chart here.
After touching a low of $1,180, XAUUSD has managed a recovery to $1,375, just shy of the pivot band at $1,390/400.

Fundamentally, XAUUSD's recent years of rally was on the back of Fed's QE, it is quite difficult to reconcile with the speculation that gold has completed its downward correction here and is due to head much higher from here when Fed is only just starting talk on tapering. Therefore, I humbly feel that this precious metal has scope for more downside and price will probably languish around the low, until maybe one day when fears of global inflation start to steal the headlines.

Technically, as long as it stays below the pivot level, probability of the yellow metal falling back to retest the recent low is high. That being said, I have observed that the recent recovery's price action has packed quite abit of momentum. As a result, there is sign of bullish convergence though its still very premature to place too much weighting on this signal. But it may give hint of a potential temporary bottom with XAUUSD going into a more elaborate consolidation between $1,200 to $1,400.
As of now, I place a higher probability of another wave lower towards $950-$1,050 to complete this cycle of correction.

Primary trend: Bearish for $950-$1,050
Intermediate trend: Range between $1,200 to $1,400

XAUUSD Monthly chart - Better perspective with a long term chart

Wednesday 24 July 2013

Are we done yet?

A very potent full moon this month indeed. With one more burst in reaction to the weaker than expected German Flash Manufacturing PMI number, E$ cleared another batch of stop orders to print a high of 1.3254, which is at the top end of my intermediate term range. At this stage, I have to believe that the risk/reward should start to favour holding short E$ with the next strong resistance at 1.3360/80. Signs of a bull USD resurgent has surfaced as we scan across the spectrum of USDxxx.

Europe order book:
Stop loss: 1.3080
Limit: 1.3125/15 and 1.3390

Primary trend: Bullish
Intermediate trend: Range between 1.2800 to 1.3200/50
Minor trend: Mildly bearish

Technically, longer intraday and daily indicators are in o/b zone. Intraday momentum continues to point higher following the surge to 1.3254 though signs of bearish divergence signal has emerged. In the days ahead, E$ is expected to fall back to the bunch of technical supports ranging from 1.3020 to 1.3090. For today, trading range from 1.3250/60 to 1.3150/70 (expanded 1.3120/30).
E$ Daily chart - Top range of intermediate trend hit 
A$ has finally broken the ascending trendline (chart does not reflect) after a rejection at around the 0.9300/20 resistance level forming a triple top. This will put pressure on the pair to test pivot at 0.9150/70 before falling back to the low end of the range at 0.9000/30. Like I have mentioned before, 0.8870/900 is a level to be reckoned with and one has to hold back being overly bearish when nearer for this round.
A$ hourly chart - Resistance band around 0.9300/50 and the support trendline

Monday 22 July 2013

The time of the month....

Market got an early treat to the full moon effect as PBOC's move on Friday and the post Japan election Monday gave speculators the best excuse to inject volatility. Despite the sharp move higher, 1.3180/200 remains intact as E$ continues to consolidate within the defined range (see chart). Likewise for A$, this pair still lacks near term direction as it consolidates within 0.9010/30 to 0.9280/310.

CFTC COT's report: Speculator's accounts as of 16 Jul 13
EUR:   -37,165 vs -40,900
JPY:    -85,762 vs  -80.305
AUD:  -70,686 vs -63,255
Except for E$, JPY and A$ have both added on to their existing short positions

Europe order book:
Stop loss: 1.2990, 1.3050-40, 1.3065, 1.3080 and 1.3200/10
Limit: 1.3055/50, 1.3125/20, 1.3170-90, 1.3200/10 and 1.3250/60

Primary trend: Bullish
Intermediate trend: Range between 1.2800 to 1.3200/50
Minor trend: Mildly bearish

Technically, intraday indicators are heading into o/b territory. Intraday momentum has been neutral and still pointing to consolidation which at current level (1.3165) would suggest higher downside risk. This is also supported by intraday trend indicator which is shows that E$ is ripe for a reversal. I shall maintain the same strategy of trading the defined range for now. For today, expected range 1.3170/90 to 1.3080/100.

E$ 8-hourly chart - Still within the defined range....

Friday 19 July 2013

xxxJPY the focus for now....

Now that Bernanke has straightened things out, I can only imagine we are left with the Japanese upper house election as the next major event risk, overshadowing the G20 meeting over the weekend. The relationship? Not too much in the USD against the world but attention will shift towards the xxxJPY which will have indirect impact. The textbook play should be buying USDJPY for Abe's victory but how the market pans out subsequently will depend largely on how much that has been factored in by Friday's close.

Europe order book:
Stop loss: 1.2990, 1.3050-40, 1.3065, 1.3080 and 1.3210
Limit: 1.3060/50, 1.3150, 1.3170-90, 1.3210 and 1.3250/60

Primary trend: Bullish
Intermediate trend: Range between 1.2800 to 1.3200/50
Minor trend: Mildly bearish

Technically, shorter intraday indicator is in o/b zone but longer ones around mid level. Intraday momentum indicator suggest consolidation and at current level of 1.3136, there is more downside bias.
Along with other technical signals, I still prefer to fade into rallies. Expected trading range 1.3170/90 to 1.3000/20. Its Friday, stay nimble, try to take as much off the table and enjoy your weekend.
E$ Daily chart - Potential price action for today....
The deeper "B" wave has unfolded in USDJPY and topped off at 100.86 before a quick correction lower. However, I am still not very convinced that USDJPY is ready for sharp sell-off just yet before another attempts for 101.53 and 103.73 which will be dogged by some choppy price action, as witnessed earlier. Staying out of this pair ahead of major risk event.
USDJPY Daily chart - Possible scenarios...
Firmer EURAUD for 1.4400 implies softer AUDUSD in the coming trading session. Expect AUDUSD to fall back to 0.9020/30 with 0.9200/20 to cap.

Thursday 18 July 2013

USD back on track.....

Market whipsaw as expected during the NY session as Bernanke clarified his stand on Fed's action on QE. Amid the volatility, DXY closed Wednesday weaker below the DMA21. USD bears' victory was short lived as the index surged through the resistance to recapture the pivot point this morning. Having observed the price action in the past 24hrs, it has become apparent that the recent USD correction might have already run its course and is ready to power ahead again in the coming weeks.

Europe order book:
EUR:
Stop loss: 1.2990, 1.3050-40, 1.3065, 1.3170-90
Limit: 1.3060/50, 1.3150, 1.3170-90, 1.3200-10 and 1.3250/60
JPY:
Stop loss: 98.80, 99.25/20, 100.45/50, 100.90/00, 101.50 and 102.00
Limit: 99.00, 100.45/50, 100.80, 100.90/00, 101.50 and 102.00

E$
Primary trend: Bullish
Intermediate trend: Range between 1.2800 to 1.3200/50
Minor trend: Mildly bullish but capped at 1.3200/50

Still maintaining my view that E$ will be capped around the upper band 1.3200/50 and eventually fall back to 1.2750/2800. But however, EUR crosses should remain relatively firm.
Technically, intraday indicator has unwound from its o/s condition but still has room on the upside. However, daily indicator is just getting into o/b level. Shorter intraday momentum indicator suggest range consolidation between 1.3080/90 to 1.3180/200 but longer ones are beginning to point lower.
Expected trading range 1.3170/90 to 1.3040/50. Prefer to fade into rallies. 
E$ Daily chart - Pretty much sums up my view for 2013....
USDJPY
In view of the USD strength, USDJPY should continue to stay firm with initial target of 101.53. However, one has to take note of the event risk i.e. the Japanese election over the weekend. Strong supports levels are 98.00/10, 99.00/10 and 99.60/70. 
USDJPY Daily chart - Y99.00 has formed a solid base to propel it higher....
AUDNZD
Price action in the past 12hrs has not been encouraging and coupled with the view that AUDUSD has probably seen its near term highs around 0.9300, I have decided to cover the long and take a small loss. In the coming weeks, I expect AUDUSD to fall towards 0.8800/50.

Wednesday 17 July 2013

Flying into the danger zone....

Having witnessed how the markets reacted to both versions of his take on QE in recent weeks, I am quite sure Bernanke would during his Humphrey Hawkins testimony deliver a message where the possible outcome will be one where he won't get himself buried by more interest payment burden. Smart choice of the sequence I must say, if it was intentional. That being said, if his message for these 2 nights at 10:00pm (Sin/HK) is going to be consistent with the latter, it will support a USD negative environment, at least in the near term after some initial vicious whipsaw.

With the main fundamental focus for the next 2 days being a pure USD against the rest of the world, E$ will somehow slip into a zombie state (look at the order book!!!) Like I have always likened E$ being caught in between 2 tectonic plates as she slips into her quasi USD role. But do not get overly bullish at current levels as we are trading around the upper band of the defined range (see chart 1). Expected range 1.3070/90 to 1.3180/200. Would prefer to trade from the short side if I have to.

USDJPY presents another direct USD play as trend indicator suggest this pair is ripe for a reversal as supported by the dark cloud cover weekly candlestick pattern. However, how deep the "B" wave can extend (see chart 2) really depends on the guidance by Bernanke. I look to fade into rallies but mentally prepared for Scenario 2. Expected trading range 97.50/70 to 99.60/80 (expanded 100.60/80). Watch support at 98.00/10.

However, if you insist on trading but hope to insulate yourself from the direct impact (kind of) from the Bernanke related volatility, one can dabble into AUDNZD where I would attempt to buy on dips. Expected trading range 1.1660/80 to 1.1810/30 (watch first resistance at 1.1740/60)

European order book:
E$
Stop loss: 1.3050/40 and 1.3170/80
Limit: 1.3170-90 and 1.3250/60
$JPY
Stop loss: 98.10/00, 100.05/10, 100.20/30, 100.45/50 and 100.90/00
Limit: 98.10.00, 100.05/10, 100.45/50, 100.75/80, 100.90/00 and 101.20

E$
Primary trend: Bullish
Intermediate trend: Range between 1.2800 to 1.3250 before 1.2400
Minor trend: Mixed with limited upside to 1.3200/50


E$ Daily chart - Right there at the upper band.....
USDJPY 8-hourly chart - How deep will this "B" wave be?

Tuesday 16 July 2013

Softer USD for now....

E$ finally took a dip below 1.3000 to 1.2993 to flush out some sell stops before it returned to the defined range. Market is looking forward to German ZEW out at 5:00pm (Sin/HK) and also Wednesday and Thursday's Humphrey Hawkins where Bernanke will be testifying.
Looking at the stop loss orders, market is seemed to be alittle lopsided and I expect a squeeze above 1.3100 in the later part of today's session. As the price action unfolds itself, the probability of seeing 1.3200/50 is getting higher.

Below are a couple of A$ charts to substantiate my view for a firmer Aussie towards 0.9350/0.9400.

Europe order book:
Stop loss: 1.3050-40, 1.3100, 1.3120/30, 1.3145/50 and 1.3170/80
Limit: 1.3145/50

Primary trend: Bullish
Intermediate trend: Range between 1.2800 to 1.3250 before lower for 1.2400
Minor trend: Mildly bullish

Technically, shorter intraday indicator was in o/b region and market in the process of unwinding. Shorter intraday momentum indicator suggests consolidation but longer intraday one is pointing higher.
Taking other technical signals into consideration, I expect an initial dip before higher again. Expected trading range 1.3010/30 to 1.3140/50.
E$ 8-Hourly chart - Strong support region


A$ Daily chart - Bullish convergence 

A$ Weekly chart - Long engulfing body Doji after prolong downtrend is an important signal....

Monday 15 July 2013

Buying time....

Following the short squeeze last week, E$ is now ensnared by moving averages in both the daily and weekly charts leaving it in a relatively tight range. The quick reversal that I was expecting on Thursday and Friday did not materialize as it held 1.3000 to close the week firm at 1.3064 forming a bullish engulfing candlestick pattern. Despite the initial bearish reversal view, one has to sit up and pay some attention and respect to that technical signal though I still maintain that the recent high of 1.3206 may still stay intact. However, I am mentally prepared for another spike higher towards 1.3250 before lower again which at the moment does not have a high probability of happening (see chart).
Surprisingly, the order book has been very light and it may appear that many are still not back into E$ yet after that vicious move. Until such time when there is big enough sell stops built below 1.3000, market is probably going to consolidate further with a slight upside bias. Hopefully, the German ZEW data due out tomorrow at 5:00pm (Sin/HK) will inject some action into this lacklustre pair.

A brief technical outlook for the following:
USDJPY: Mildly bullish for 101.00 but be aware that last week closed a dark cloud cover candlestick pattern. Coupled with signal that this pair is ripe for a reversal in the trend indicator, one has to avoid getting overly bullish.
AUDUSD: Decreasing downside momentum with bullish convergence and potential reversal signal in the trend indicator should alert one not to get overly bearish especially when nearer 0.8850/900.

CFTC's COT report: Speculator's accounts as of 9 July 13
EUR:  -40,900 vs -16,090
JPY:   -80,305 vs -70,736
AUD: -63,255

Europe order book:
Stop loss: 1.2995
Limit: 1.2930/20 and 1.3005/00
(Note: the large sell interest and stop order at 1.3130-50 is no longer around)

Primary trend: Bullish
Intermediate trend: Bearish for 1.2400
Minor trend: Mixed

Technically, most indicators have gone into neutral zone and today's range is expected to be confined within 1.3020/30 to 1.3080/90.
E$ Weekly chart - Another possible scenario....

Thursday 11 July 2013

End of USD bull trend? .... Wait!

Market has definitely gotten ahead of itself and this overnight vicious shortcovering must have been painful for some. Very clearly, the overnight price action is so characteristic of a short squeeze and needless to say, its objective was to flush out the loads of buy stop orders.
I don't get it right all the time but this round has been really fulfilling, in a way vindicated. Especially when I anticipated this move since last week and expressed in "Watch EURAUD....", 4 Jul Thu. Clueless as I may have sounded on Tuesday, its often a turning point, laced with uncertainties. For those who were patient with me, "Hardier than expected...", 10 Jul yesterday, would have gotten you out of trouble or helped you make some money.
So is this the end of the USD rally? I beg to differ and feel that this blip is but a correction within a bullish USD trend, which have another wave to go (see 10 Jul and today's charts).

Europe order book:
Stop loss: 1.3000, 1.3210 and 1.3250
Limit: 1.3130-50

Primary trend: Bullish
Intermediate trend: Bearish for 1.24
Minor trend: Bearish for 1.2750/2800

Technically, this is a very uncommon move as E$ breached more than 2 standard deviations in the overnight rally based on time and price (for the shorter intraday technical readings). Shorter intraday indicators are in o/s level now, whereas the longer intraday ones are close to o/b condition. At this moment, intraday momentum indicator signals are inconclusive due to this unusual price action. From here, I expect 1.3080/3100 (1.3150/80 stronger resistance) to cap any rebound and market to drift back towards 1.2900/30 today.
E$ Daily chart - 1.3200 objective met!!


Wednesday 10 July 2013

Hardier than expected....

Dovish comments from ECB's Asmussen and Italy's downgrade pressured E$ through the 1.2800 option barrier and sell stop orders to print a low of 1.2755 yesterday. To add on to the bearish tone, it closed at 1.2780, a trigger for Goldman Sachs to cut loss on their long euro call. This morning, China's weaker than expected trade figures sparked a sell-off in the AUD, pulling the E$ lower but it only managed to print 1.2765 low before rebounding (A$ staged an even more spectacular rebound). The next focus will be minutes from the FOMC meeting which will be released at 2am (Sin/HK, 11 Jul) and Bernanke will be speaking at 4:10am (Sin/HK, 11 Jul). I have in my previous updates expressed my apprehension of getting overly bearish E$ when closer to 1.2800 and I am still standing by that view at this point in time. Though I am not expecting a major reversal here but there are increasingly more technical signals that support a deeper rebound before E$ resumes its bearish trend (see chart). This view will be invalidated if 1.2745 is broken with a close below. In the same vein, I do see a A$ rebound to 0.9350/80.

Europe order book:
Stop loss: 1.2735/30, 1.2745/40 and 1.2860/65
Limit: 1.2700 (opt), 1.2755/45 and 1.2880/900

Primary trend: Bullish
Intermediate trend: Range between 1.32 to 1.24
Minor trend: Mildly bullish (corrective)

Technically, shorter intraday indicator is in o/b level but the longer intraday ones are only just coming out of the o/s territory. The daily indicator is still in o/s condition. Shorter intraday momentum indicator is suggesting consolidation which at current level of 1.2805, there is still some room on the upside. But longer intraday to daily indicators are still pointing lower. Bullish convergence signal has emerged and that also has increased the probability of a near term bottom. Expected trading range 1.2780/90 (stronger support at 1.2750) to 1.2880/90 (stronger at 1.2920/30)
E$ Daily chart - Though E$ closed below 1.2800 yesterday, I still can't get overly bearish, at least for now........

Tuesday 9 July 2013

Tough call....

Despite the much stronger US employment data last Friday, market failed to follow through with the selling pressure and that encouraged shortcovering taking E$ to an intraday high of 1.2898 clearing some weak buy stops along the way. Is the market still fixated with the recent USD positive development and looking to fade into any E$ rally? At the moment, short term technical signals are quite mixed and I will have to remain patient and not force a view. When in doubt, I will fall back to my intermediate trend view for guidance. For now, last heard there is a large option barrier at 1.2800 and that together with the sell stop orders at 1.2790 may become a magnet for another test there before any rebound towards the trendline support turned resistance at around 1.2930/50.

Europe order book:
Stop loss: 1.2745/40, 1.2790, 1.2845/40, 1.2900-10 and 1.2950/60
Limit: 1.2930/35

Primary trend: Bullish
Intermediate trend: Range between 1.32 to 1.24
Minor trend: Mixed to Mildly bullish (corrective)

Technically, intraday indicators have come off its o/s condition but the daily is still in o/s zone (see top chart). Momentum indicators are showing a mixed bag of signal. However, trend indicator is showing that E$ is ripe for a near term bounce. Expected trading range 1.2820/30 (1.2780/90 expanded) to 1.2930/50.

E$ Daily chart - Potential brief rebound to unwind o/s condition before lower again....
E$ Monthly chart - Down then up into Q4 

Monday 8 July 2013

Confirmation....

In a way, Fed is vindicated from even contemplated tapering the bond buying programme sooner than expected. Evidently, with the latest overwhelming US employment data, we are now in a relatively clear cut position where US is ready to wean off from QE whereas Eurozone is still languishing with potentially negative interest rate. Any doubt on the sustainability of the recent USD resurgence will be put to rest and the investment community is probably more convinced and ready to embrace this scenario (herd instinct). A stronger corrective rebound in currencies is now delayed. Just a sidetrack..... With the current development, it will be quite difficult to believe that XAUUSD (Gold) is ripe for another bull run, at least not before another leg lower. I will be updating on XAUUSD in the coming days since the second target has been touched in "Initial target hit, whatz next for XAUUSD?", 15 Apr 13.

CFTC COT Report: Speculator's accounts as of 25 Jun 13
EUR: +17,357 vs +20,030
JPY:   -61,462 vs -61,890

Asia order book:
Stop loss: 1.2750/46, 1.2940/50 ans 1.2975/80
Limit: 1.2750/46, 1.2805/00, 1.2940/50 and 1.3040/50

Europe order book:
Stop loss: 1.2745/40, 1.2790 and 1.2930/35
Limit: No noteworthy orders

One of the very rare occasions where these noteworthy orders changed that much.

Primary trend: Bullish
Intermediate trend: Bearish for 1.2400
Minor trend: Down / Up (mildly bullish - corrective)

Technically, shorter intraday indicators have unwound from its o/s environment but longer intraday/daily are in extreme o/s territory. Shorter intraday momentum indicator is suggesting consolidation but longer intraday/daily are still pointing firmly lower. Taking other technical signals into consideration, I see spillover momentum in E$ to test briefly below 1.2800 before a rebound. Expected trading range between 1.2760/70 to 1.2860/70. Stronger support at 1.2750 and resistance at 1.2920/30.

E$ Daily chart - Last line of defence....

Friday 5 July 2013

ECB Draghi did it again....

ECB Draghi's dovish comments dragged E$ lower overnight touching a low of 1.28828. E$ lost ground as ECB chief signalled that negative interest rate may be tolerated. This is an important development and it can have lasting effect on the E$ and its crosses. Looking at the top chart, its clear that the major trendline (black) has been broken and it is highly likely that the neckline region (1.2800/50) will be tested today though I may not get overly bearish there. Market focus is on the US Non-farm Employment Change data this evening (8:30pm, Sin/HK). Heard last night that sovereign bids were seen around 1.288ish, coupled with profit taking provided near term support. Looking at the 2nd chart, it is apparent that EURAUD could start to consolidate with a downward bias which may also indicate a USD correction. Therefore, I do see a short term recovery in A$ and N$, which could provide E$ with some support (can be quite a tricky situation).

Asia order book:
Stop loss: 1.3050-55, 1.3070-80 and 1.3100/10
Limit: 1.3040/50 and 1.3070-80

Primary trend: Bullish (Under review)
Intermediate trend: Bearish for 1.24
Minor trend: Mildly bearish for 1.2800/50

Technically, intraday to daily indicators are in o/s territory. Intraday to daily and weekly momentum indicators are all pointing to lower E$. I expect a trading range between 1.2800/30 to 1.2950. Can't get overly bearish when nearer 1.2800 and remember its Friday. Stay nimble and learn to take profit, never wrong!
E$ Daily chart - Trendline supports

E$ (Black) & EURAUD Daily chart - Breakdown in correlation but for how long? 

Thursday 4 July 2013

Watch EURAUD...

Happy Independence Day to my American friends. That will also imply sub-optimal liquidity during the Europe/NY session where ECB will make its Minimum Bid Rate announcement (7:45pm, Sin/HK) and Press Conference (8:30pm, Sin/HK).
Yesterday, E$ shortcovered as expected and it surged to a high of 1.3033 after touching a low of 1.2923. Rate has come off and currently consolidating around 1.2980/90. I have to admit that technical signals are mixed. While on one hand I see E$ testing 1.2800/50 and 1.3150/80, question here is the sequence. Looking at AUD$ (0.9105), I see a good chance of a rebound into 0.93ish and EURAUD (1.4265) falling back to test 1.40ish. For your information, for EURAUD to fall, the likelihood is for AUD$ to stay firmer, at least for this round. The bullish convergence in E$ continues to warn the bears, while the daily and weekly momentum indicators continue to point to lower rates. Looking at the order book, market does look like its caught short for now.

With this mixed view, I shall present a couple of scenarios here in order of probability:
Scenario 1: E$ holds 1.2923 and rally for 1.3150/80 before turning lower again for 1.2800/50.
Scenario 2: E$ drops on ECB' dovish comments to 1.2800/50 before rallying sharply for 1.3150/80 in the days ahead.

Europe order book:
Stop loss: 1.2905/00, 1.2930/20, 1.3050-55, 1.3070-80, 1.3100/10 and 1.3120
Limit: 1.2905/00, 1.2930/20, 1.3040/50 and 1.3070-80

Primary trend: Bullish
Intermediate trend: Range between 1.28 to 1.33
Minor trend: Mixed


E$ 4-Hourly chart - Bullish convergence keep bears cautious...

Wednesday 3 July 2013

Trendlines the magnet....

Negative fundamentals emanating from Greece and Portugal helped the market decide after several days of consolidation between the daily Ichimoku cloud (1.2990/3000) and the bunch of MAs (1.3055-85). Admittedly, I was hoping to see E$ move higher before I fade into that rally targeting the lower band of the intermediate trend range. Now that E$ has broken out of the consolidation, near term picture remains bearish for the trendlines from around 1.2860 to 1.2800 (see chart). But before one jumps onto the bandwagon, watch the o/s signal and take advantage for better entry level.

Europe order book:
Stop loss: 1.2905/00, 1.3070-80 and 1.3100/10
Limit: 1.3055 (opt) and 1.3070-80

Primary trend: Bullish
Intermediate trend: Range from 1.28 to 1.34
Minor trend: Bearish for 1.2800/50

Technically, intraday indicators have all gone into o/s level and current rebound is unwinding that extreme condition. At this moment, various intraday momentum indicators are showing mixed signals but the daily and weekly ones are pointing lower. This may suggest an intraday shortcovering from here before E$ retest today's low of 1.29235 either today or tomorrow. Top of daily Ichimoku cloud stands at 1.2995 and DMA100 at 1.3050 are the formidable resistance. Only a daily close above 1.3090/3100 can relieve the near term bearish pressure.
E$ 8-Hourly chart - Daily MAs won and trendlines targets for now but.... 


Tuesday 2 July 2013

Slight upside bias..... (Update 1)

E$ continues to be trapped between the strong support at 1.3000 and the bunch of daily MAs ranging from 1.3055 to 1.3085. However, I foresee a breakout within 24hrs. This week will be a bit trickier to "feel" the cycle as US celebrates Independence Day on Thursday and then followed by the important US Change in Non-farm Payroll numbers. In the meantime, it does seem like market is caught slightly short and the buy stops may end up being the more attractive target for this round.

Europe order book: (Updated in italic and underlined)
Stop loss: 1.2980-70, 1.3015/10, 1.3075-80 and 1.3100/10
Limit: 1.2960/50, 1.2985/90 and 1.3075-80

Primary trend: Bullish
Intermediate trend: Range between 1.28 to 1.34
Minor trend: Mildly bullish for 1.3170/90 (1.3220/50 expanded)

Technically, shorter intraday indicators have moved into o/b level but the longer ones are above the 50% but still off the o/b zone yet. Intraday momentum indicators have turned from consolidation to an upside bias which has increased the probability of a break to the upside. First important resistance is at 1.3100/05, clearing which exposes 1.3140/50, 1.3170/90 and then 1.3220/50. Yes, quite abit of headwind and be forewarned not to get overly bullish when nearer 1.3200 and do tread with caution. For today, 1.3030/50 to hold for now.

Update1: Europe order book has been updated. Last heard Asian sovereign sales above 1.3070. Still a tough call to go long until at least a close above the daily MAs. But by then, there is not really alot of mileage left. Would already be looking for sell opportunity when nearer 1.3200. Therefore, unless infront of the screen, it will be more of a momentum buying on break of 1.3100 for a quick run for 1.3140/50. Has to stay nimble.
E$ 8-Hourly chart - Short term bottom at 1.3000 should trigger a mild rebound

Monday 1 July 2013

Still below daily MAs....

E$ only managed 1.31029 high before falling all the way back briefly below 1.3000 and then closed at 1.3007 on the last day of the 1H 2013, where the high this year has so far been 1.37108 and low 1.27447. Admittedly, I never saw the sell-off coming but am already happy having caught the initial move up.  Today, we started the 2H just above the 1.3000 level and have so far tested up to 1.3053. In view of E$ closing below the bunch of daily MAs (MA100 - 1.3059, MA200 - 1.3075, MA50 - 1.3085), one has to admit that the bears have an upper hand for now. Market's main focus will obviously be the US Change in Non-farm Payroll number this coming Friday.

CFTC COT report (Speculator accounts): As of 25 Jun 2013
Eur: +17,357 vs +20,030
Jpy:  -61,462 vs  -61,890

Europe order book:
Stop loss: 1.2985/80 and 1.3120
Limit: 1.2960/50 and 1.3060-80

Primary trend: Bullish
Intermediate trend: Range between 1.28 to 1.34
Minor trend: Mixed

Technically, shorter intraday indicator is in the o/b territory but longer intraday is still coming out of the o/s zone. Do note that the daily indicator is still in the o/s level. Intraday momentum is suggesting range consolidation for now. Frankly, I struggle to put together a view for today and when this happens, it will be a low probability call. The range of least resistance/support is 1.3000 to 1.3050 and expanded range 1.2970/80 to 1.3070/80.
E$ Daily chart - Bunch daily MAs still a threat to E$ bulls

Friday 28 June 2013

Patience is key....

Despite the exceedingly good US pending home sales data last night, E$ held 1.3000 and quickly rebounded to its comfort zone around 1.3030/40 and consolidated till now.With HK's property cooling measures in place, we don't need a rocket scientist to do the maths to determine the latest destination of the wealthy Chinese's investment.
For the past 24 hrs or so, though E$'s trading range has been tight and unexciting, it has in fact revealed a couple more supporting signals for an imminent rebound. Firstly, 1.3000 seems to hold quite well and secondly, price has drifted past trendline resistance turned support (see chart). Of course, E$ bulls still have quite abit of work to do as it is currently still trading below important pivots, the daily MA100 (1.3064), MA200 (1.3074) and MA50 (1.3085). However, other bullish signals like the bullish convergence and o/s daily indicator keeps hope alive, not forgetting the firmer EURxxx.

NY order book: (from last evening)
Stop loss: 1.2985/80, 1.3055-60, 1.3065-70 and 1.3110
Limit: 1.2960/50

Primary trend: Bullish
Intermediate trend: Range between 1.28 to 1.34
Minor trend: Mildly bullish for 1.3200/50

Technically, shorter intraday indicators are approaching o/b zone but still room for upside move. Longer intraday indicators are only just coming out of the o/s territory. Intraday momentum indicators are beginning to turn from mixed to slight upside bias. Taking into consideration all other technical signals, R/R favours trading from the long side. Expected trading range 1.3010/30 to 1.3130/40. Its Friday, stay nimble and learn to take alittle profit around the daily MAs if momentum starts to falter.
E$ Hourly chart - More signals to support a rebound

Thursday 27 June 2013

Finding a bottom....


Europe order book:
Stop loss: 1.2985/80, 1.3050-60, 1.3067-70 and 1.3110
Limit: 1.2960/50 and 1.3070/80

Primary trend: Bullish
Intermediate trend: Range between 1.28 to 1.34
Minor trend: Mildly bullish

Technically, shorter intraday indicator has come way off the o/s territory though the longer one is still just coming out of the o/s zone. Intraday oscillator indicators are showing a mixed bag of signals. Expect an initial see-off to retest yesterday's low of 1.2985 but I can't get overly bearish as bullish convergence signals have emerged and the daily indicator is at the o/s zone. Expect today's range 1.2960/80 to 1.3060/80.

E$ Hourly chart - More bullish convergence. R/R should caution getting overly bearish here...

Wednesday 26 June 2013

Counting down....

E$ continues to consolidate in a lacklustre fashion as if it was awaiting a certain trigger for a move either way. 1.3030/40 (61.8% fibo retracement) is probably a level market hopes to achieve if overwhelming and relevant fundamental is available to trigger that move. If not, strong bids around 1.3060/50 and the string of buy stops would mean a short squeeze being a more attractive proposition.

Asia order book:
Stop loss: 1.3115, 1.3130, 1.3160/65, 1.3175/80 and 1.3200/10
Limit: 1.3030-20 and 1.3060/50

Primary trend: Bullish
Intermediate trend: Range between 1.28 to 1.34
Minor trend: Mildly bullish - Corrective rebound for 1.3200/50

Technically, intraday indicators have all slipped back into the o/s territory though not extreme. Intraday momentum indicators are suggesting consolidation but the daily is still pointing lower which calls for caution as general trend remains bearish. However, with the emergence of the bullish convergence signal, it has increased the probability of a near term bottom forming. For today, I expect trading range between 1.3030/40 to 1.3180/3200.

E$ Hourly chart - Bullish convergence has increased probability of rebound

Tuesday 25 June 2013

Lopsided order book an implication?

Overnight, E$ dropped to a low of 1.3059 before it shortcovered to print 1.31458 high and subsequently closed at 1.3117 to form a "doji". Up till this point in time, the price action is very much within expectation except that it has not pushed higher yet. Looking at the order book, it is quite apparent the stop loss orders are quite lopsided. Market focus is on the US durable goods data at 2030hrs (Sin/HK) and US consumer confidence at 2200hrs (Sin/HK) for today and probably the ECOFIN meeting starting tomorrow.

Europe order book:
Stop loss: 1.3030-20, 1.3160, 1.3175/80 and 1.3200/10
Limit: 1.3030-20

Primary trend: Bullish
Intermediate trend: Range between 1.28 to 1.34
Minor trend: Mildly bullish for 1.3200/50

Technically, shorter intraday indicator are nearing the o/b level but longer one is still in the o/s zone. Shorter intraday momentum continues to suggest consolidation while the longer one is still pointing lower. Looking at other technical signals, I expect E$ to hold 1.3070/80 for a test towards 1.3200 in the next 36hrs. Still prefer to trade on the long side until 1.3059 compromised.

E$ 8hourly chart - Expect a bounce into 1.3200/50 within 36hrs but can't get overly bullish.... 

Monday 24 June 2013

E$ to correct recent fall....

In my last update "Bears to take a break...", 20 Jun13, E$ performed as expected over Thursday to Friday with price first falling to 1.3161 before a mild rebound to 1.3254. It then subsequently fell to my forecast target of 1.3100/20 and for today, we have just touched a low of 1.3079. In just over 3 days, E$ has lost three hundred and thirty + pips. What next? Though last week's candlestick range did not totally satisfy the criteria of a bearish engulfing pattern, its strong downward momentum has already revealed itself up till this point in time. However, latest technical signals are starting to show signs of a near term bottom and it will be elaborated in the technical section. In the meantime, the German Ifo Business Climate number at 1600hrs (Sin/HK) should be the highlight for today.

CFTC COT report - Speculative account (as per 18 Jun 13)
Net EUR: +20,030 vs -7,533
Net JPY:  -61,890 vs -72,906

Europe order book:
Stop loss: 1.3030-20, 1.3180 and 1.3200/10
Limit: 1.3030-20, 1.3075-70 and 1.3150

Primary trend: Bullish
Intermediate trend: Range between 1.28 to 1.34
Minor trend: Mildly bullish

Technically, intraday indicators are in o/s levels. Shorter intraday oscillator indicator is showing signs of bullish convergence and suggest consolidation, which at current level of 1.3100 would imply more upside potential. However, caution must still be taken as longer intraday momentum indicator is still pointing down for now. After the low of 1.3079 is seen, the probability of a stronger rebound to correct last week's fall is probably going to take place. For today, expected range 1.3060/80 to 1.3170/90 and I prefer to trade from the long side.

E$ Daily chart - Risk/reward favours a corrective rebound

Thursday 20 June 2013

Bears to take a break....

Thank goodness the E$ outlook is not as hazy and hazardous as the air over us (some politicians have to be more responsible).
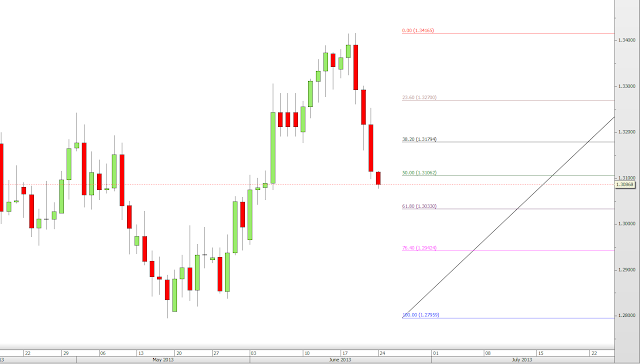
In my update titled "Eyes on Bernanke..." (22 May 13), my target of 1.34/35 for the intermediate trend has been achieved and E$ should now be due for a correction lower whereas the greenback will take centre stage once again. In yesterday's brief update, my target of 1.3250 has also been hit and E$'s next target could be 1.3100/20.

Europe order book:
Stop loss: 1.3150 and 1.3416/17
Limit: 1.3150 and 1.3400

Primary trend: Bullish
Intermediate trend: Range between 1.2800 to 1.3400
Minor trend: Bearish

Technically, shorter intraday indicator has gone into extreme o/s level but the longer one still has abit more room for further downside. Shorter intraday momentum indicator is starting to show a slowdown in the rate of selling though the longer one is still pointing firmly lower. In view of this conflicting signal, one cannot get overly bearish when E$ nears the 1.3160/80 band (on first test) for this round. At this stage (low so far 1.3193), I would expect E$ to attempt another low before a mild rebound towards 1.3250/60. I would look to fade into the rally but that should be held back till tomorrow.
E$ 8hourly chart - E$ to retrace from recent rally

Wednesday 19 June 2013

Bears to take over soon...

I shall resume with the more elaborate analysis from tomorrow.

But for now, I can't get overly bullish when E$ crosses above 1.3400. For this round, 1.3500 seems toppish and risk/reward favours fading into rally with rates potentially falling back to 1.3250.

We should slip into the full moon zone by the time Fed makes the press conference tonight. So be careful of the characteristic whipsaw price action and stay nimble.


Thursday 30 May 2013

The time has come....

Spectacular rally in E$ exceeded my expectation by a touch to print high of 1.2977. Looking at the recent sessions (see chart with eclipse), one would have noticed that each sell-off is followed by a bullish engulfing candlestick pattern the very next day. Combining this occurrences with other technical signals, the probability of E$ breaking out and up has increased significantly. Note that a survey with traders revealed that many are still favouring to fade into rally just below 1.3000 with tight stops.

Europe order book:
Stop loss: 1.2890 and 1.3050/55
Limit: 1.2990/300

Primary trend: Bullish
Intermediate trend: Bullish
Minor trend: Bullish (Down/Up market with potential for breakout)

Technically, intraday indicator is in the o/b zone. Shorter intraday oscillator indicator is suggesting consolidation which at current level would mean more downside bias. However, the longer intraday momentum indicator is still pointing firmly higher. Taking all available intraday technical signals into consideration, the highest probability scenario would be a down first then up market. Expected range 1.2890/910 to 1.3050/70. Initial strong resistance at 1.3020/30 and strong support at 1.2830/40. Prefer to buy dips.

E$ Daily chart - Bull up for a breakout


Wednesday 29 May 2013

No incentive to breakout....

E$ remained stucked within the defined range as expected. It was sold off during the NY session and consolidated till early Europe came in to knock it lower to 1.2838. Having studied the Asia order book, I expect the 1.28/1.30 range to hold for at least another 24 hours. There is basically no notable stop loss orders on the outside of the range to incentivize any breakout for now.

Asia order book:
Stop loss: Nil
Limit: 1.2750, 1.2820/00, 1.2993-98 and 1.3000

Primary trend: Bullish
Intermediate trend: Bullish
Minor trend: Bullish within the defined of 1.2800 to 1.3000

Technically, intraday indicator is at o/s level after the sell-off last night. Intraday oscillator indicator continues to suggest consolidation which at current level of 1.2845, there is more mileage on the upside. First level of strong resistance stands at 1.2890/2900. Expected range for today, 1.2820/40 to 1.2950/60. Risk/reward favours going long.
E$ 8Hourly

Tuesday 28 May 2013

Range defined for now....

Looking back at the past 8 days' price action, one would have noticed the defined range of 1.2800 to 1.3000. With the more recent rejection at the 1.3000 resistance, E$ could be pressured to retest the lower band of the range this week. The 61.8% retracement level is at 1.2873 and the trendline is around 1.2850 where some stop loss orders are currently lurking. Having said that, we have to take note that last week actually closed a bullish piercing candlestick pattern. Therefore, one should not get overly bearish when near to the lower band. For today, without much fundamentals driving the market, it may end up being stop loss seeking, whichever is nearer (check out the Europe order book).

CFTC COT speculator's orders as of 21 May 2013:
Eur: -80,949 vs -46,921  (net shorts increased by 73%)
Jpy: -95,186 vs -78,560

Europe order book:
Stop loss: 1.2860/50, 1.2960/65 and 1.3050
Limit: 1.2820/00, 1.2993-98 and 1.3000

Primary trend: Bullish
Intermediate trend: Bullish
Minor trend: Bearish within the 1.2800-1.3000 range

Technically, intraday indicator is at around the neutral 50. Intraday oscillator indicator is suggesting consolidation within 1.2890/900 to 1.2960/70 before expanding to 1.2840/50 - 1.2960/70 during the NY session. I would look to fade into the rally for today with risk above 1.3000.

E$ Daily chart - Defined range for next 48 hours

Wednesday 22 May 2013

Eyes on Bernanke....


Currently, the 1.3000 pivot is the level to watch and recapturing would relieve the recent bearish pressure on E$ and should subsequently see E$ trade up to test 1 May's high of 1.3243. Gentle reminder that today is the start of the full moon zone and I am sure Ben Bernanke is going to inject volatility into the market when he testifies tonight at 10pm (Sin/HK).

Europe order book:
Stop loss: 1.2750/35, 1.2940/50, 1.2960/70 and 1.2970/300
Limit: 1.2790/70, 1.2820/00 and 1.2860/40
Orders do look very lopsided with strong bids below and buy stop orders lining up to 1.3000.

Primary trend: Bullish
Intermediate trend: Bullish for 1.34/1.35 (unless 1.27447 is breached)
Minor trend: Bullish for 1.3000

Technically, intraday indicator has swung into o/b zone and that will probably add on more resistance for rate to pull higher. However, intraday oscillator indicator is still showing momentum pointing firmly higher. Expected trading range 1.2850/70 to 1.2980/300. Risk/reward still favours buying on dips.

E$ Daily chart - Mean reversion?