Tuesday, 9 April 2013

Bearish divergence but bulls still stubborn....

Spillover momentum from last week took E$ to a high of 1.3068 before easing off to low of 1.3005 and  consolidating around current levels. However, today's spike higher was not supported by strong enough momentum resulting in a first sign of technical weakness - bearish divergence. It may still be premature to determine that E$ has seen its near term top and will need more signals to confirm. Meantime, I maintain initial target of 1.3130/40 before a deeper correction, potentially back below 1.2900. Fundamentally, Wednesday's FOMC minutes could be a trigger to stop E$'s recent rally in its path. This can be followed up by market switching attention to any new negative development out of the eurozone toward the later part of the week.

Primary trend: Bullish
Intermediate trend: Bullish
Minor trend: Up / Down (toppish nearer 1.3130/40)

European order book: (stop orders are building up on either end and starting to get interesting)
Stop loss: 1.2890, 1.2940, 1.2995/90, 1.3070/80 and 1.3130
Limit: 1.2900, 1.3070/80 and 1.3100/15

Technically, intraday indicator is near o/b condition. Shorter intraday oscillator indicators are staring to turn lower which suggest range consolidation. Longer intraday momentum is still pointing higher though. For today, I expect range between 1.2970/80 (on first test) to 1.3080/1.3100 (expanded 1.3130/40, where I will be keen to fade into with a stop above 1.3180).
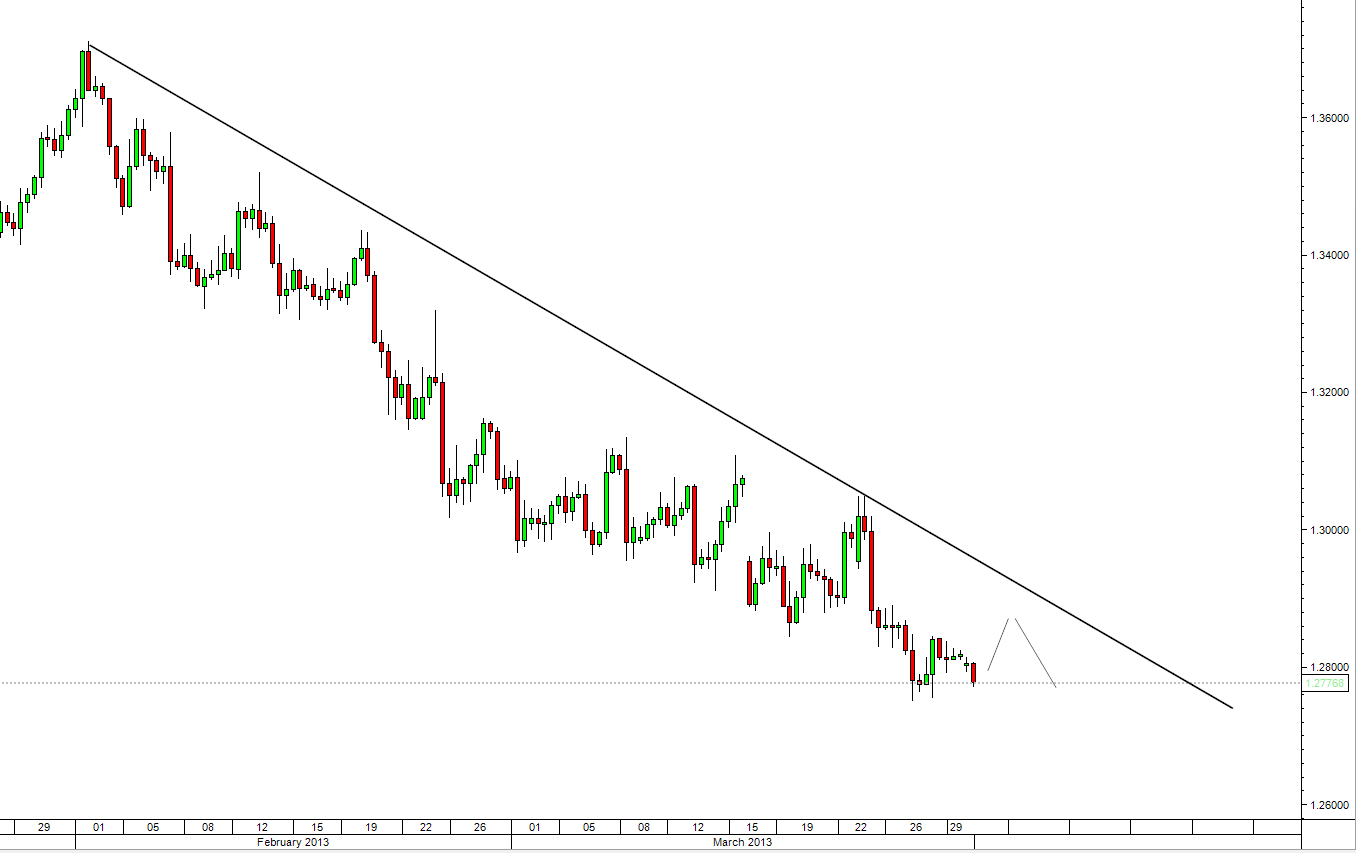
E$ 4-hourly chart - Bearish divergence, first sign of weakness

Monday, 8 April 2013

Intermediate trend changed but....

Weaker than expected US job data gave E$ another boost in an already technically bull-up environment, rallying to a high of 1.30394 before easing to close the week at 1.2993. As guided in "Initial sign of market reversal, 5 Apr", a close above 1.2940/50 is definitely a welcome sign for the bulls as it has formed a bullish engulfing candlestick pattern, a relatively reliable reversal signal. Price action was impulsive and this goes inline with the bullish primary trend. Intermediate trend is confirmed to have flipped from bearish to bullish as a result of E$ breaking above the bearish channel and closing above the DMA21 and 200. Daily and weekly momentum have turned up suggesting scope for 1.3400/3500 level to be retested. Having said that, I must warn that minor trend can still be a counter-directional sharp correction (can be as deep as back to 1.2750/60) before higher again. Probability of occurrence may not be high but it cannot be discounted totally. The key fundamental drivers this week will be Wednesday's FOMC meeting minutes (Thu, 11Apr 2am Sin/HK) and Eurogroup meeting from Friday.
Spillover upside momentum should push E$ higher in the earlier part of the week before we spend the rest of the week testing the downside with a small probability of a recovery on Friday.

Primary trend: Bullish
Intermediate trend: Bullish
Minor trend: Down / Up

CFTC COT report revealed that non-commercial speculative accounts added to their net euro short position at -65,701 vs -49,095. This was the largest net euro short position since 27 November 2012. For the Yen, speculative accounts on the contrary trimmed their net short position to -78,171 vs -89,149. Above behaviour seem to suggest that market will be vulnerable to short squeezes in the euro and a continuation in the already sharp rally in USDJPY toward Y100.

Asian order book:
Stop loss: 1.2890 and 1.2970
Limit: 1.3050 and 1.3100/15

Technically, intraday indicator is approaching o/b level with still scope for more upside. Shorter intraday oscillator is suggesting consolidation but the longer intraday is still pointing firmly higher. Expected range 1.2920/40 to 1.3090/3110 (expanded 1.3130/40) on first test. Can't get overly bullish when above 1.3100 for this round.
E$ Daily chart - Broken out and up for the next few weeks

Friday, 5 April 2013

Initial sign of market reversal....

E$'s initial rally was on the back of ECB leaving rate unchanged, followed by a much higher than expected number of weekly jobless claims out of the US. But Draghi's dovish comment gave market the perfect excuse to push E$ to 1.2745, flushing a series of sell stops. E$ then consolidated off the low for awhile before the short squeeze came in 2 waves with no fundamental news to support. The final wave shot to a high of 1.2948, clearing another series of buy stop orders. This kind of price action normally happens during the full moon zone though.
After last night's remarkable rebound, many are quick to change their E$ view from bearish to bullish though I feel can still be premature.

Primary trend: Bullish
Intermediate trend: In the process of flipping from bearish to bullish. Stayed above bearish channel and DMA200. Technically more bullish if weekly close above 1.2890 or even better above 1.2940/50.
Minor trend: Consolidation lower before higher

Europe order book:
Stop loss: 1.2850/40, 1.2890 and 1.2975/85
Limit: 1.2950 and 1.3050

Technically, intraday indicators are still unwinding from overnight's o/b condition. Intraday oscillator indicators at this point of writing is pointing higher but if price continues to consolidate lower, it may turn to consolidation which if E$ is at current level, it would mean more downside bias. However, daily momentum has turned higher. Expected range 1.2840/50 to 1.3000/30 on first test. For today, I have to admit that I don't have a good feel of the market rhythm.


E$ Daily chart - Pierced through bearish channel and above DMA200

Thursday, 4 April 2013

Stop loss orders seeking....

Not too sure if Fed's Williams spooked the market or there were other reasons. But his comment on Fed imminent cut back on its massive bond-buying program this summer if the economy continues to pick up steam, would be something that one should sit up and start paying attention to. Xauusd dropped sharply, US equity market closed weaker and firmer USD throughout Asia. It does look like the recent correction in the greenback is probably over and its resuming its bullish run. Look at AUDUSD, despite the good set of economic data, this commodity currency was being sold off. Let's not go against the grain now and should position ourselves for firmer USD. That being said, I expect initial pressure on E$ to flush out the string of sell stops below before it rebound.

Primary trend: Bullish
Intermediate trend: Bearish for 1.2650/80 (still within bearish channel and below DMA200)
Minor trend: Mixed (down / up market)

Europe order book: (Interesting)
Stop loss: 1.2705/690, 1.2735/30, 1.2755/50, 1.2785/75, 1.2800/790, 1.2885, 1.2900/10 and 1.2920/30
Limit: 1.2705/690, 1.2755/50 and 1.2800/790

Technically, E$'s inability to break new ground yesterday topping off only at 1.2864 would put pressure on this pair to restest recent low 1.2750. Intraday oscillators have turned lower again. For today, expected range 1.2730/40 to 1.2850/60. But refrain from getting too bearish when nearer 1.2700.

E$ Daily chart - Seeking to retest recent low of 1.2750


Wednesday, 3 April 2013

Eyes on ECB....

E$ retested the DMA200 and topped off at 1.2877 before retreating to current level just below 1.2800. A bounce was expected on the later half of yesterday's session but it did not materialize but instead it closed a dark cloud cover candlestick pattern and that should put pressure on E$ for at least the first half of the trading session. Gathering all available technical signals, the bears should have an edge unless 1.2877 is taken out and that would open up 1.2930/50. But for now, expect market to trade within 1.2760/70 to 1.2870/80 with consolidative price action.

Primary trend: Bullish
Intermediate trend: Bearish for 1.2650/80 (still within bearish channel and below DMA200)
Minor trend: Mixed with slight upside bias

Europe order book:
Stop loss: 1.2730, 1.2755/50, 1.2885, 1.2900/10 and 1.2930/50
Limit: 1.2700, 1.2755/50 and 1.2780/70

Technically, intraday indicators have slipped into o/s zone though not at extremes. Intraday oscillators are suggesting range bound which at current level would mean more upside bias. Daily momentum continues to point lower. Quite the typical price action ahead of ECB tomorrow and Friday's US employment numbers. For today, trade the range with tight stops knowing the intermediate trend remains bearish.

E$ Daily chart - Still below DMA200

Tuesday, 2 April 2013

E$ finding support as USD fades...

Optimum liquidity should return to the market as most centres are back from the Easter holiday. E$ spent most of Monday session short-covering and then pushed higher on the back of weaker-than -expected US March ISM data, clearing a batch of buy stop at 1.2845/50 and printing high of 1.2867 before easing to consolidate around current level. More stop loss orders above continue to attract attention and momentum seems to be able to support another run for 1.2950/60. Market's first focus is on RBA rate announcement later at 11:30am (Sin/HK).

By the way, there seem to be sign of USD running out of steam in recent days.

Primary trend: Bullish
Intermediate trend: Bearish for 1.2650/80 (degree of bearishness has fallen as momentum seems to be turning higher. However, still within bearish channel and below DMA200)
Minor trend: Mixed with upside bias

NY order book:
Stop loss: 1.2730, 1.2755/50, 1.2890/910, 1.2920 and 1.2930/50
Limit: 1.2700, 1.2755/50 and 1.2875

Technically, intraday indicators are getting into o/b zone though not extreme. Shorter intraday oscillators are still suggesting consolidation but with slight upside bias. Longer intraday oscillator though still pointing lower but waning. In summary, technical signals favour another day of higher price action with initial resistance 1.2875/85 for a correction lower to 1.2800/20 (on first test) before another push for 1.2940/60. However, I do not foresee E$ being able to sustain above 1.2900 for this round. I prefer to buy the dip before 1.2900 is seen first.

E$ Daily chart - Retest DMA21 at 1.2930/40

Monday, 1 April 2013

Range trade....

Amid a lacklustre and illiquid environment, market remains focus on the heightened worries about debts and fiscal problems in the eurozone. A weak weekly close at 1.28168 should put recent low of 1.2751 as target for retest this week with lots of economic data releases to provide the impetus. Other than the tension in the Korean peninsula, we have ECB rate announcement on Thursday and US employment numbers on Friday. As mentioned earlier, E$ remains technically weak considering where it closed for the week and for the month. We should see initial sell pressure but that being said, E$ may start to find a base from the recent sell-off in April.

Primary trend: Bullish
Intermediate trend: Bearish for 1.2650/80 (still within bearish channel, below DMA200)
Minor trend: Bearish

CFTC COT non-commercial speculator accounts revealed that euro net short position has increased to -49,095 vs -24,787. Net short jpy was reduced marginally to -89,149 vs -93,763.

Asia order book:
Stop loss: 1.2700, 1.2750, 1.2850 and 1.2900/10
Limit: Barrier at 1.2700

Technically, intraday indicators are slipping into o/s zone though still far from extreme. Shorter intraday oscillator indicators are still suggesting range consolidation between 1.2750/60 to 1.2840/50 for now, though the longer intraday momentum is still pointing lower. With today's environment, barring any major random news, trade above range with tight stops.

E$ 8-hourly chart - Too many centres off for Easter, lacklustre drift